
Below are the key graphs from the ReFuelEU Aviation Annual Technical Report 2026.
You can filter the results to view data at Union level or focus on a specific Member State.
Aviation Fuel Suppliers

Reporting status – SAF and aviation fuel quantities
This graph is only available at Union level.
Reporting status – Aviation fuel properties
This graph is only available at Union level.
Total amount of SAF supplied
This graph is only available at Union level.
Historical SAF supplied
This graph is only available at Union level.
Type of SAF supplied
This graph is only available at Union level.
SAF feedstock by origin
This graph is only available at Union level.
SAF supplied by feedstock composition
This graph is only available at Union level.
Aviation fuel composition
This graph is only available at Union level.
SAF CO2e savings

| Emission reduction by RFEUA SAF eligible category | ||
|---|---|---|
| Aviation biofuels | Other aviation biofuels | Advanced aviation biofuels |
This graph is only available at Union level.
Aircraft operators
Reporting status
This graph is only available at Union level.
Uplifted versus required fuel
This graph is only available at Union level.
Yearly uplift
This graph is only available at Union level.
SAF purchased
This graph is only available at Union level.
SAF intended to be claimed in an MBM scheme
This graph is only available at Union level.
Percentage of biofuel
| RFEUA eligible category | Fuel quantity | Share |
|---|---|---|
| Aviation biofuels | ||
| Other aviation biofuels | ||
| Advanced aviation biofuels | ||
| Synthetic aviation fuels | ||
| Not categorised |
This graph is only available at Union level.
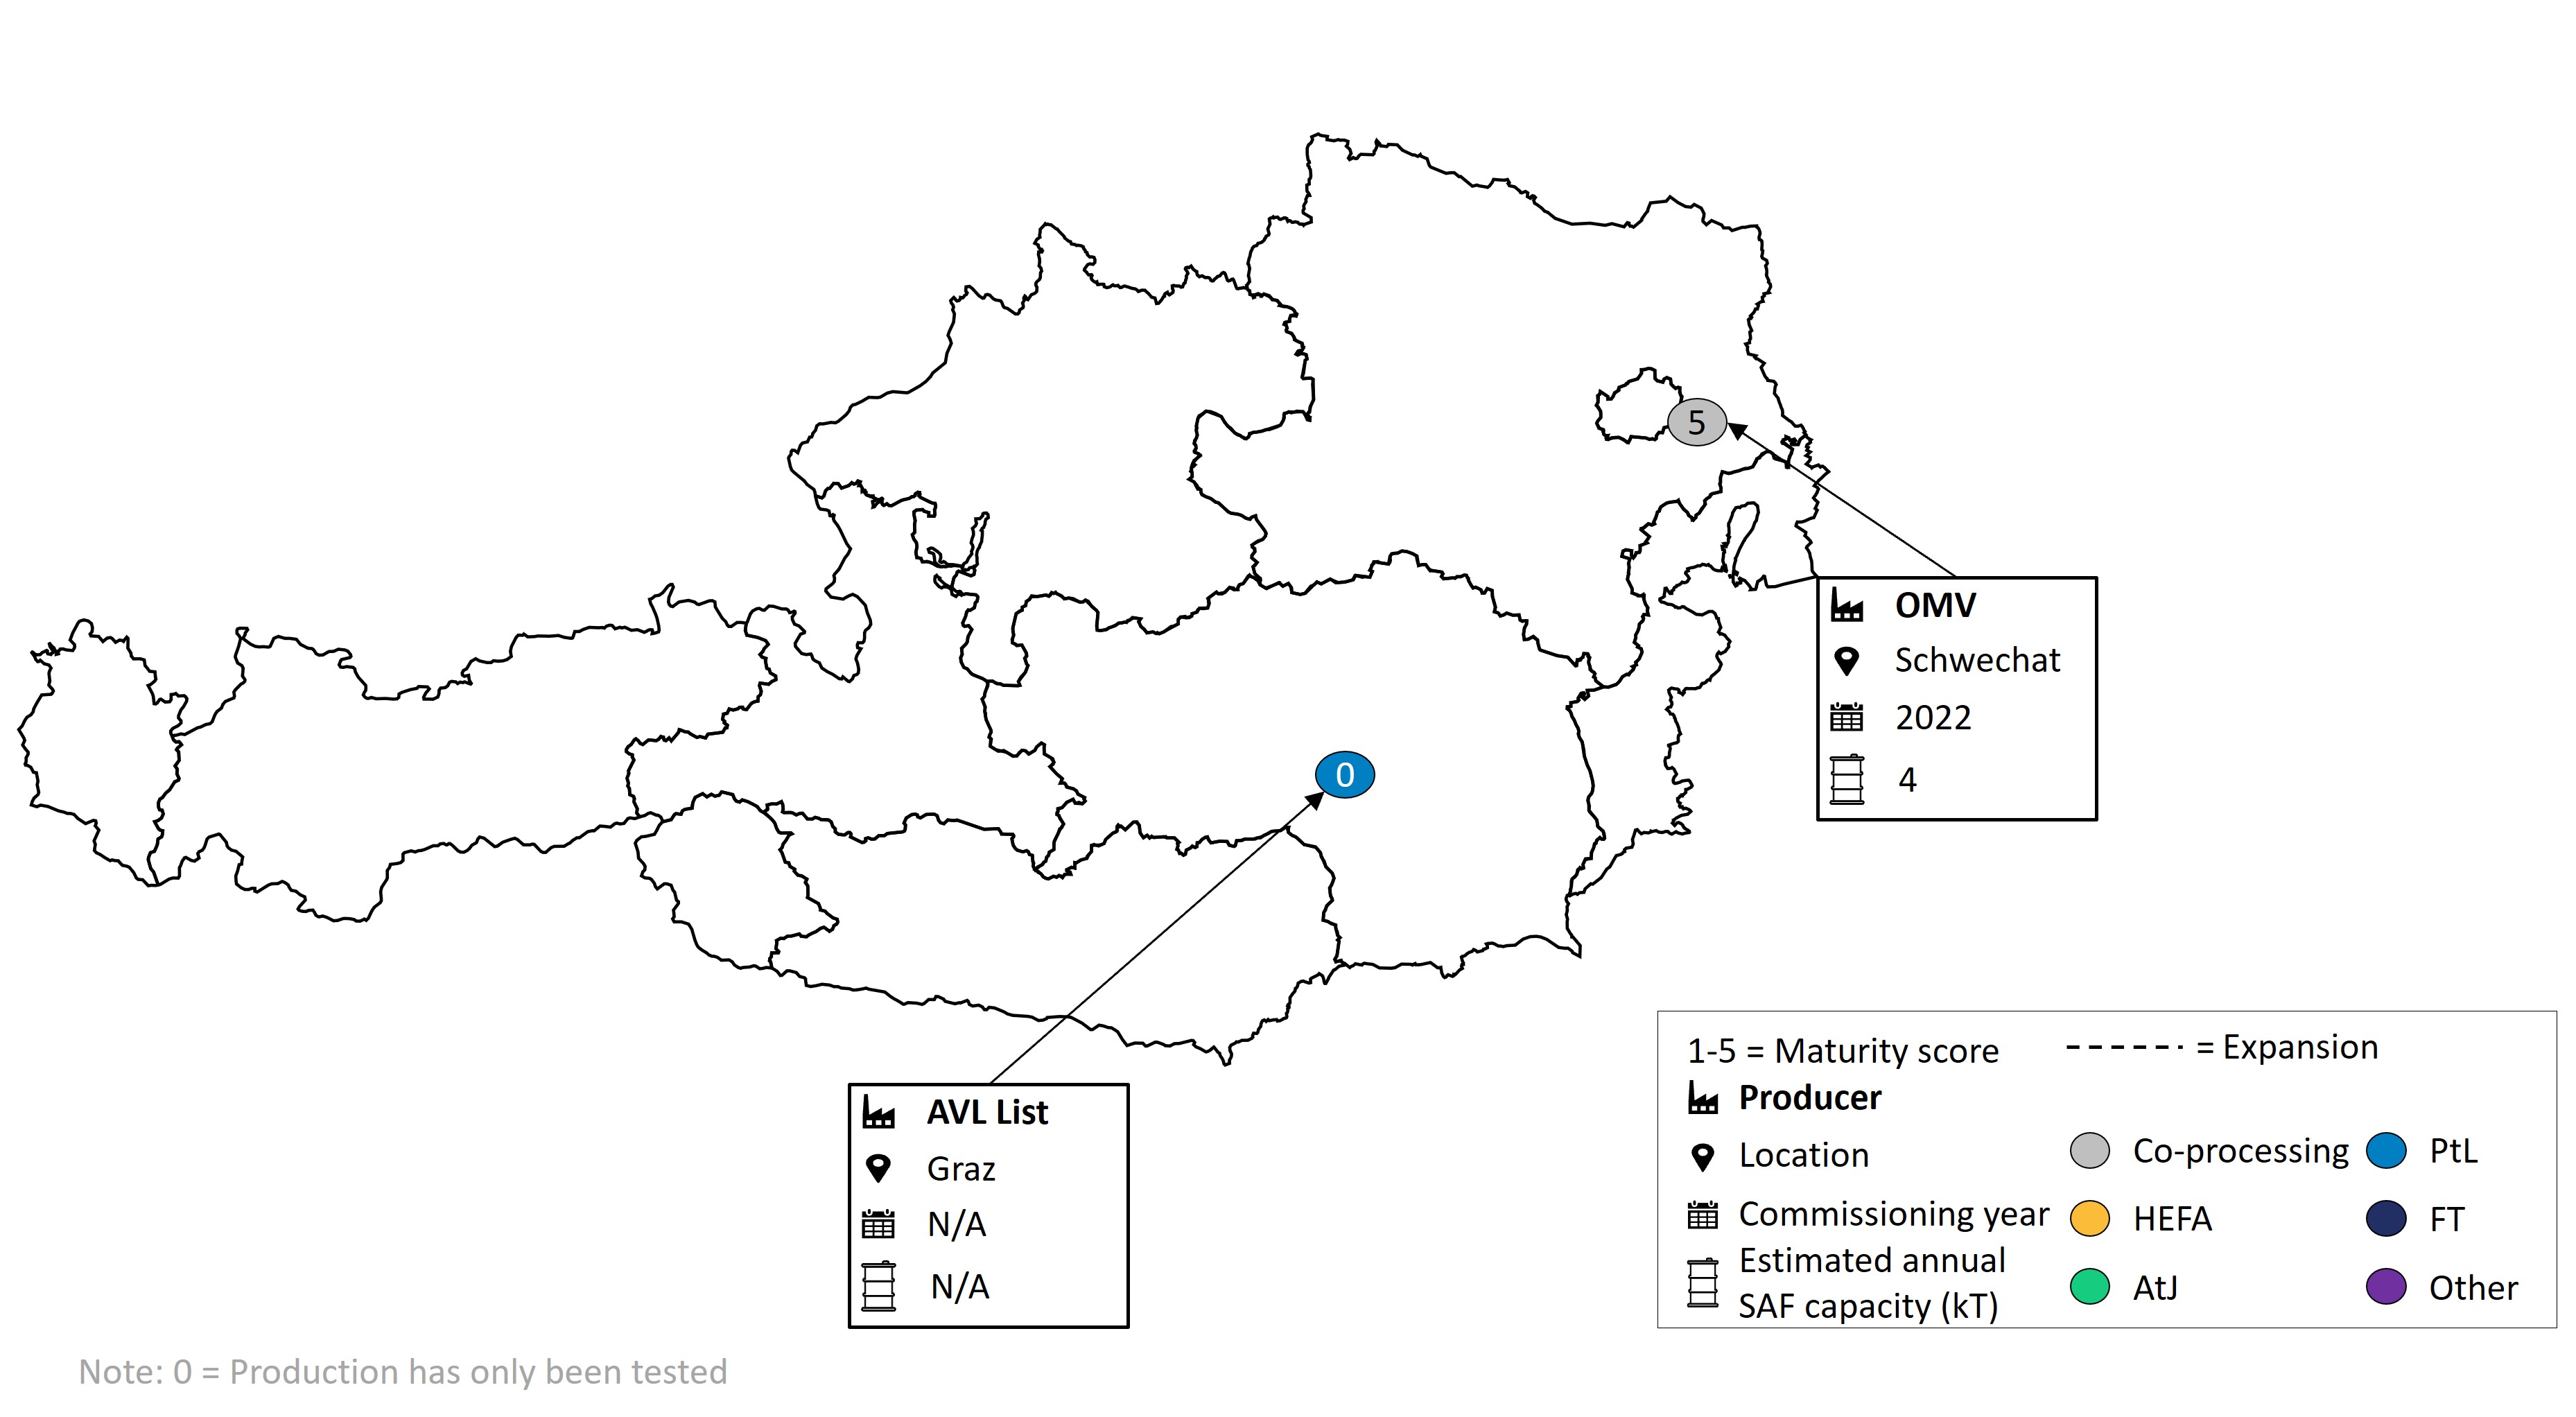
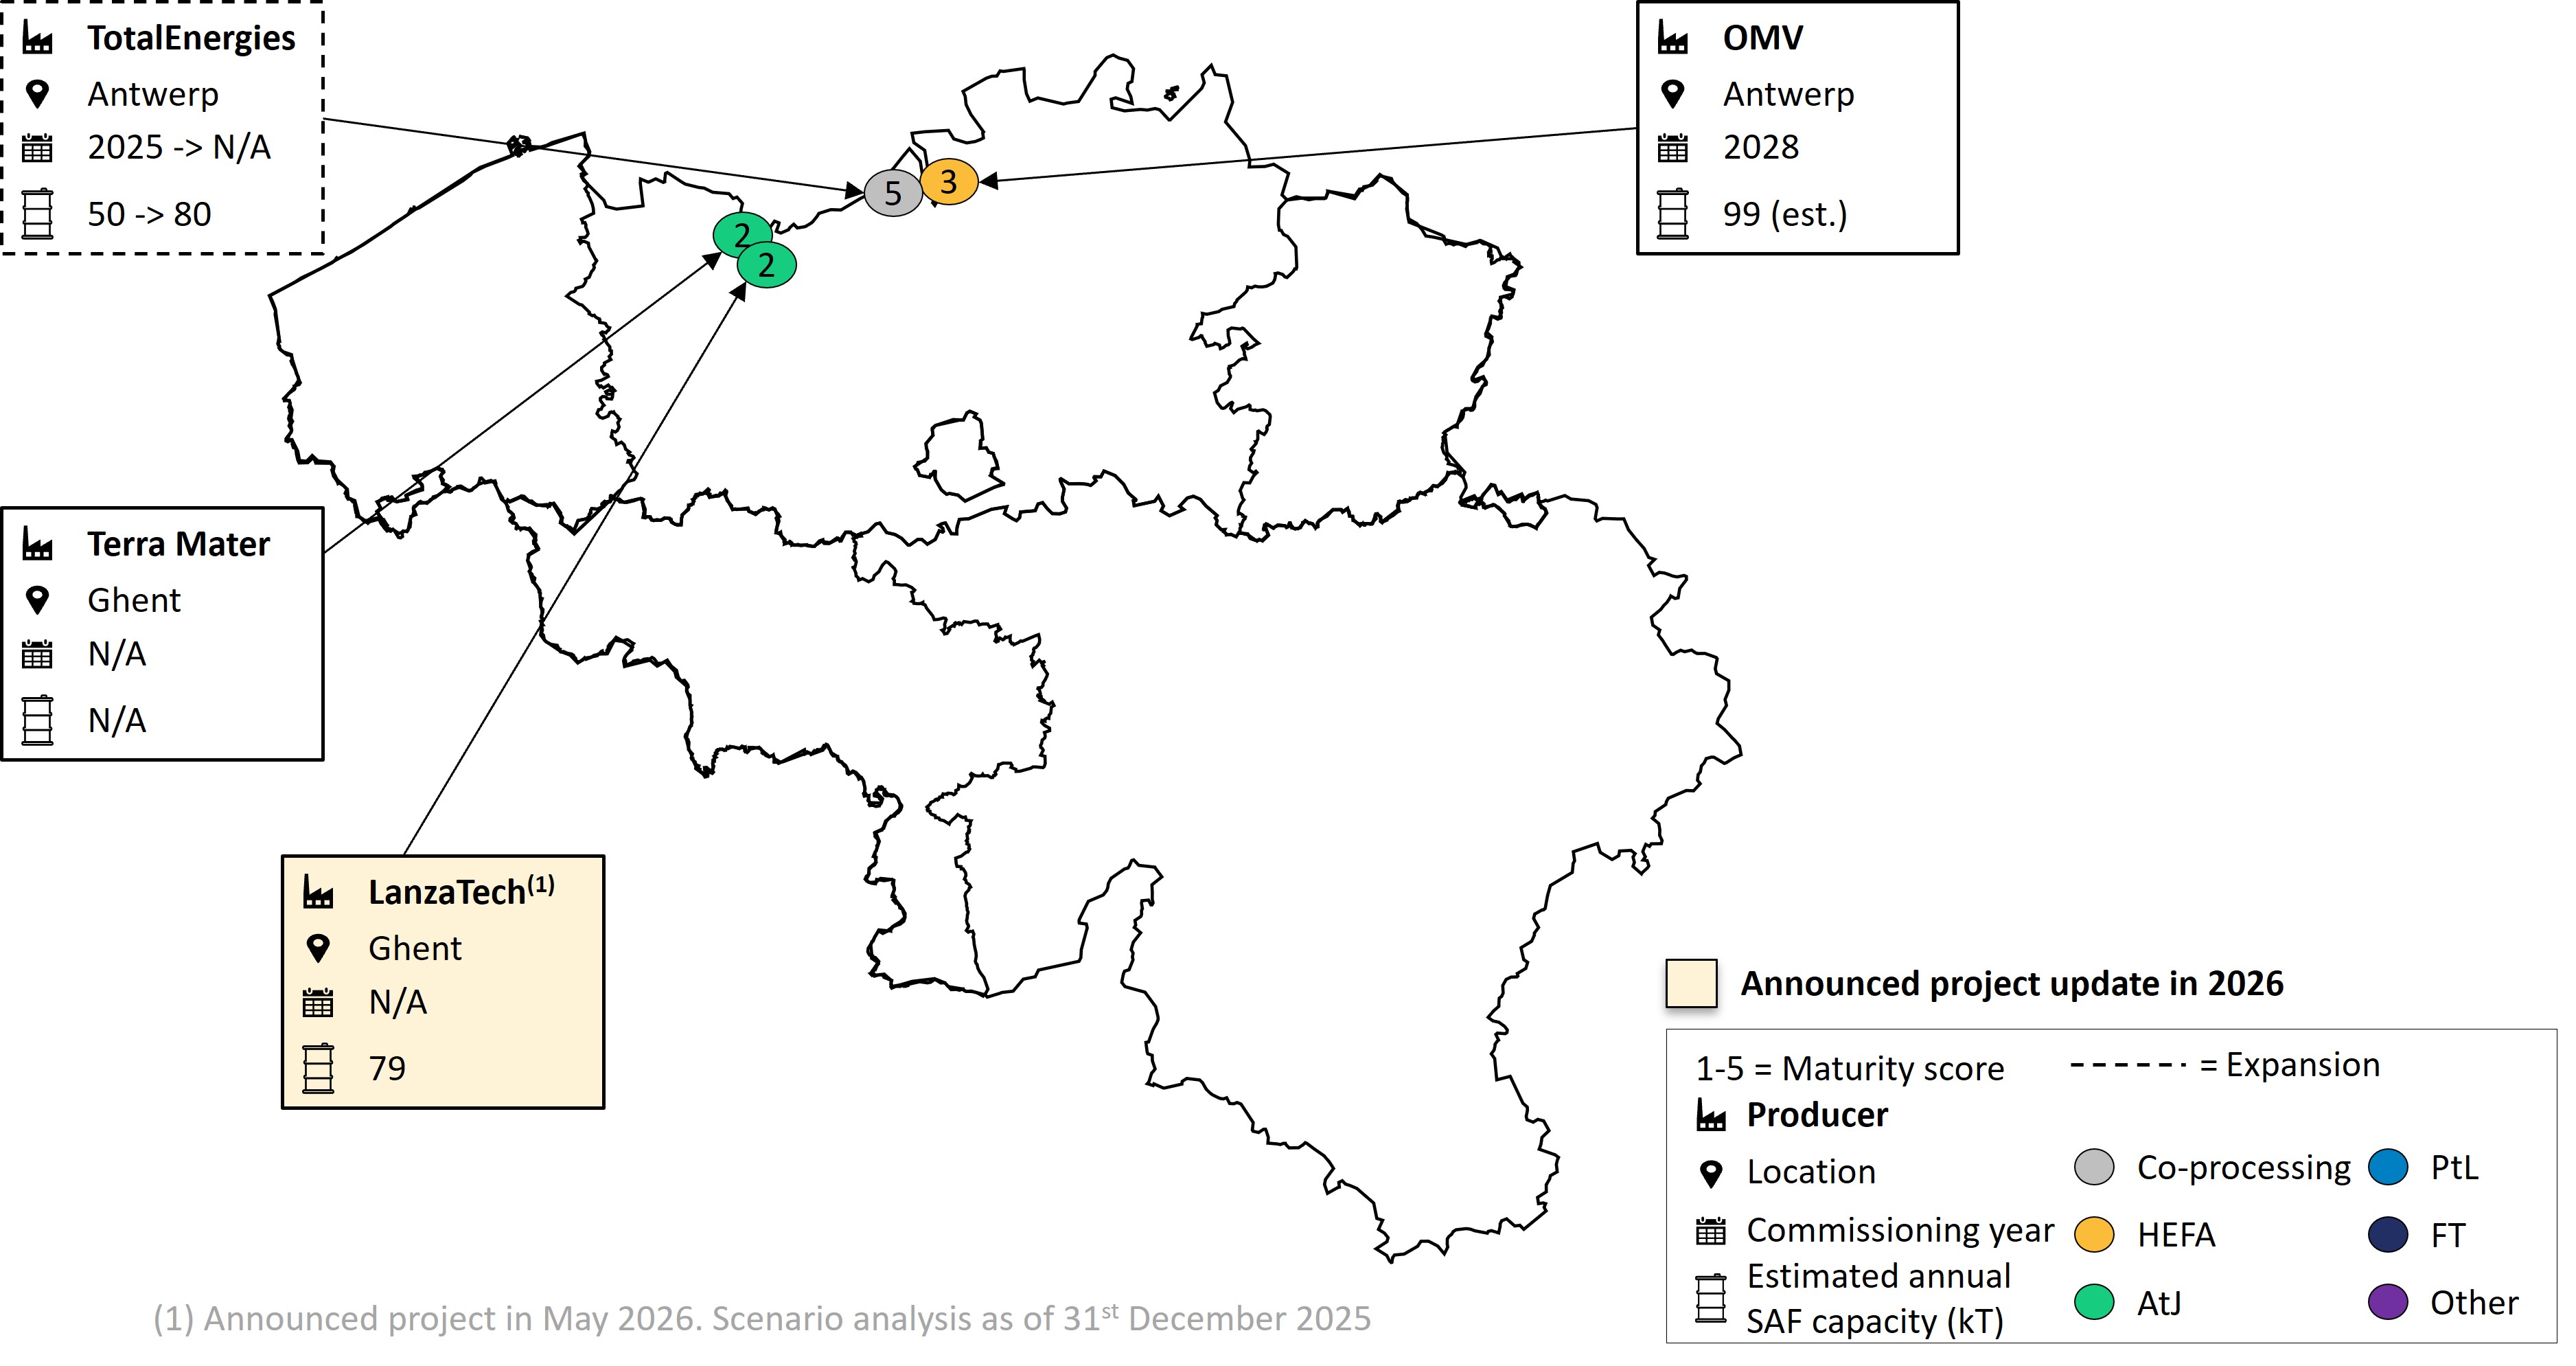
SAF Activity
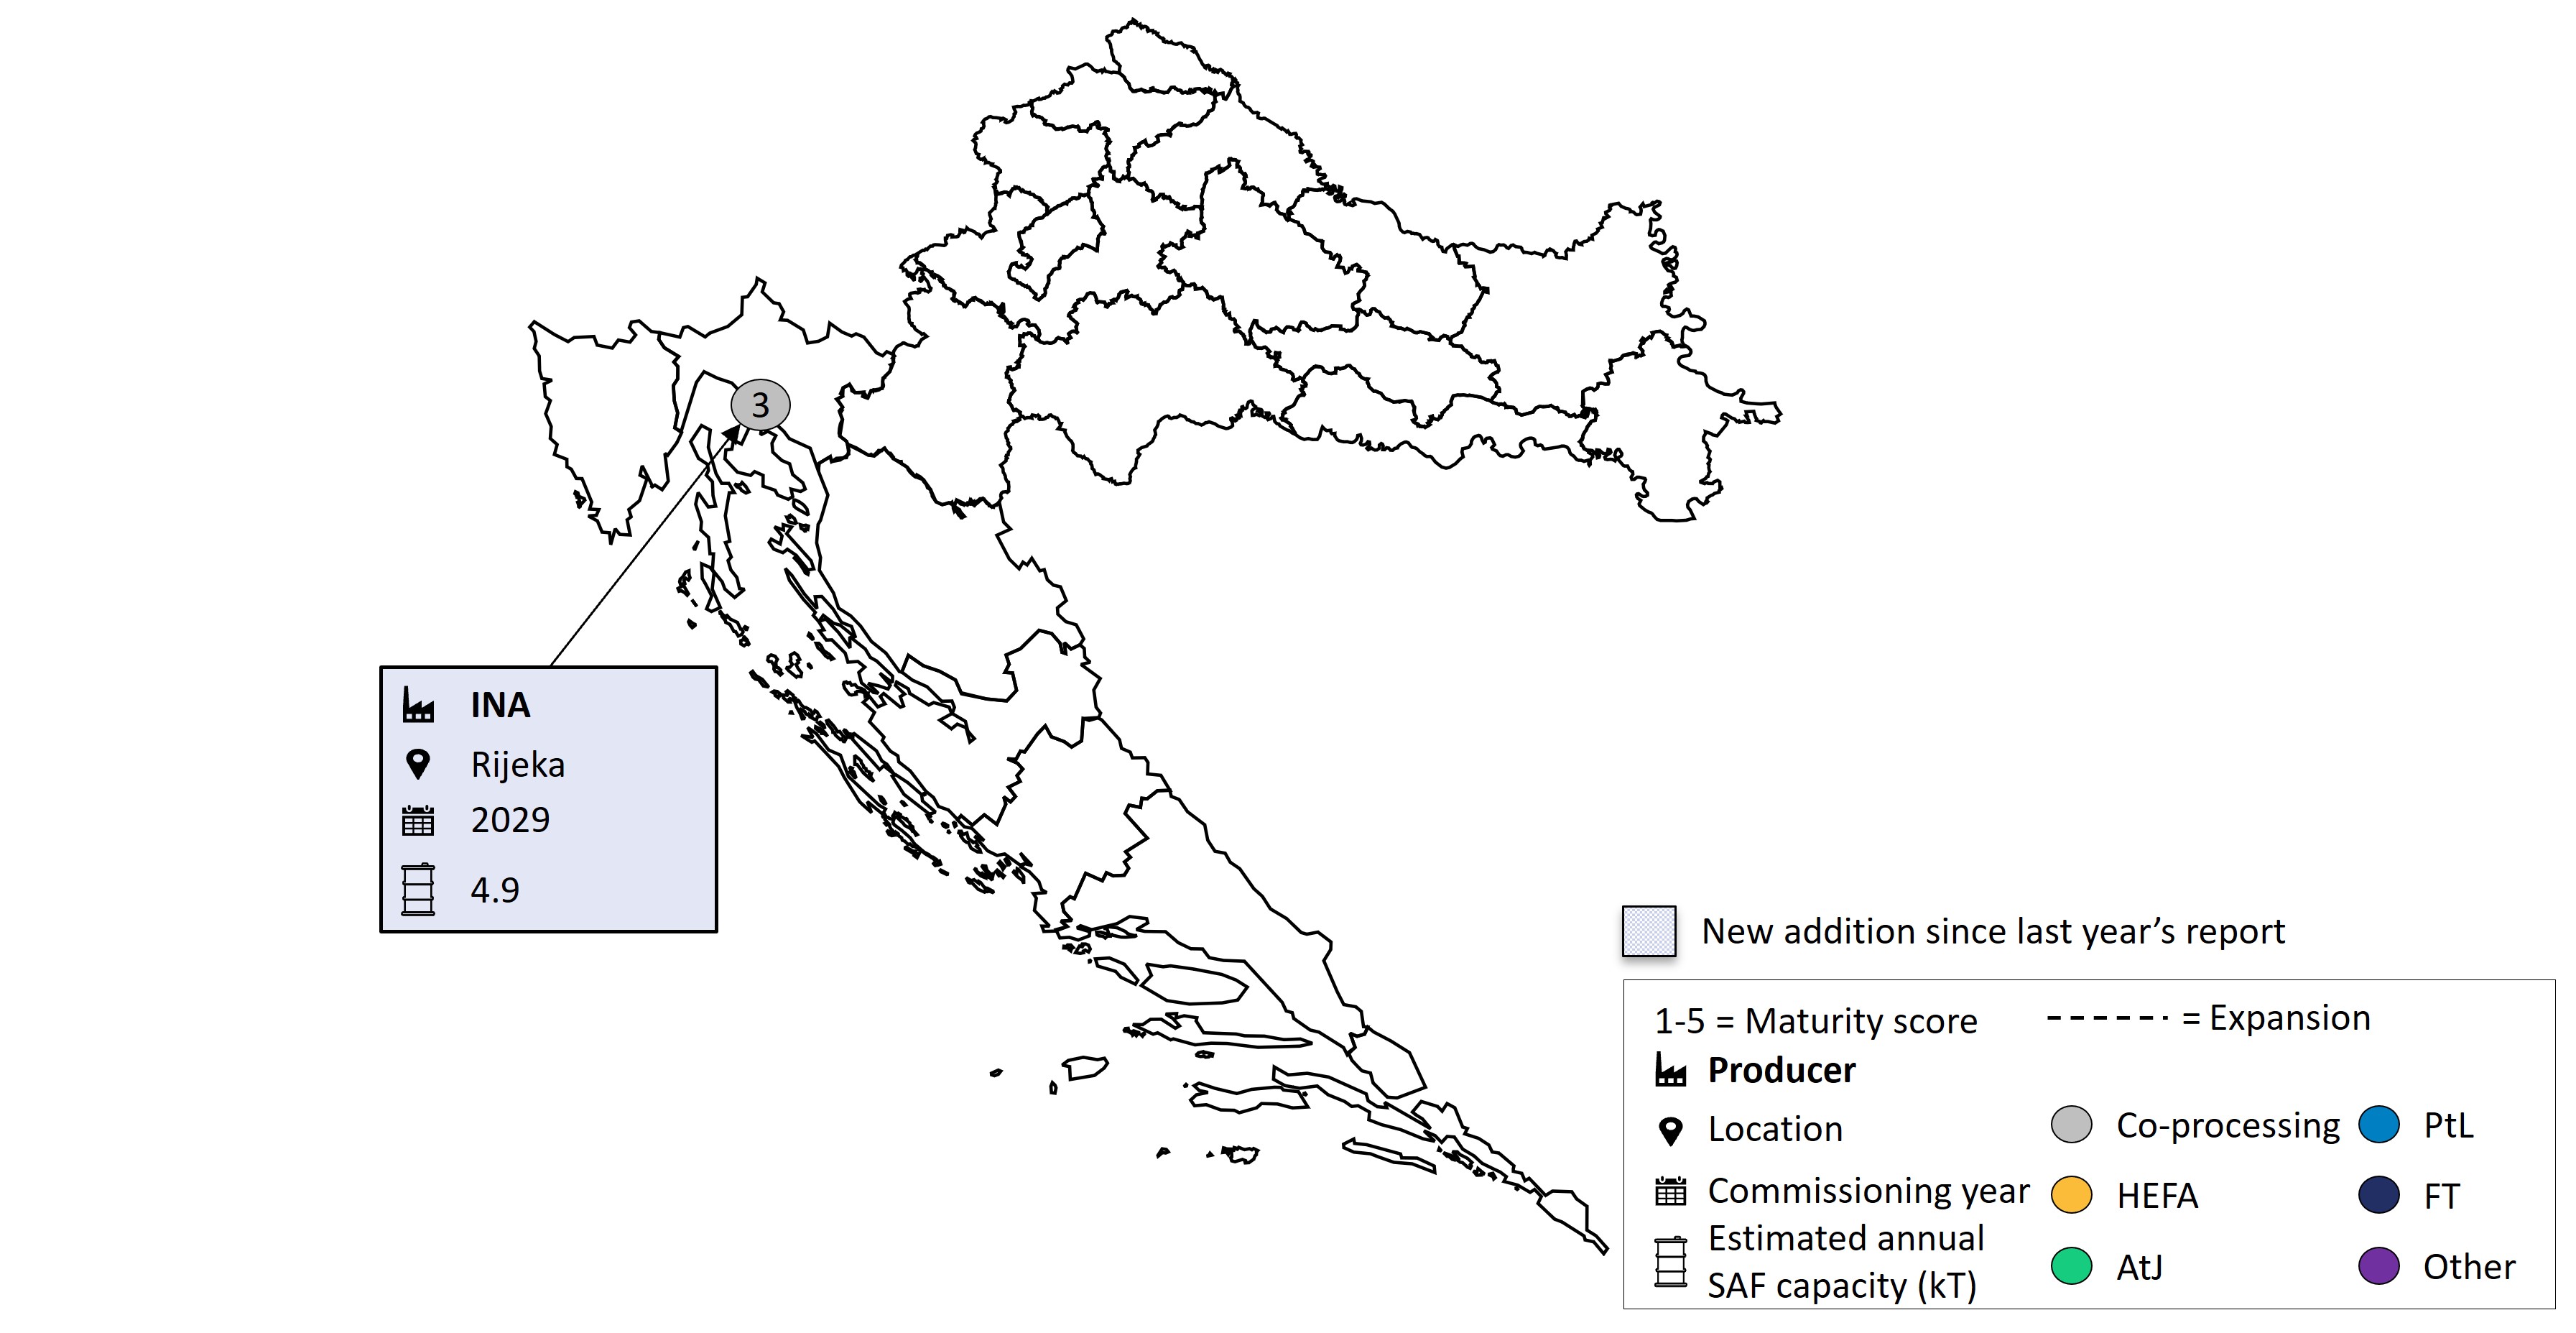
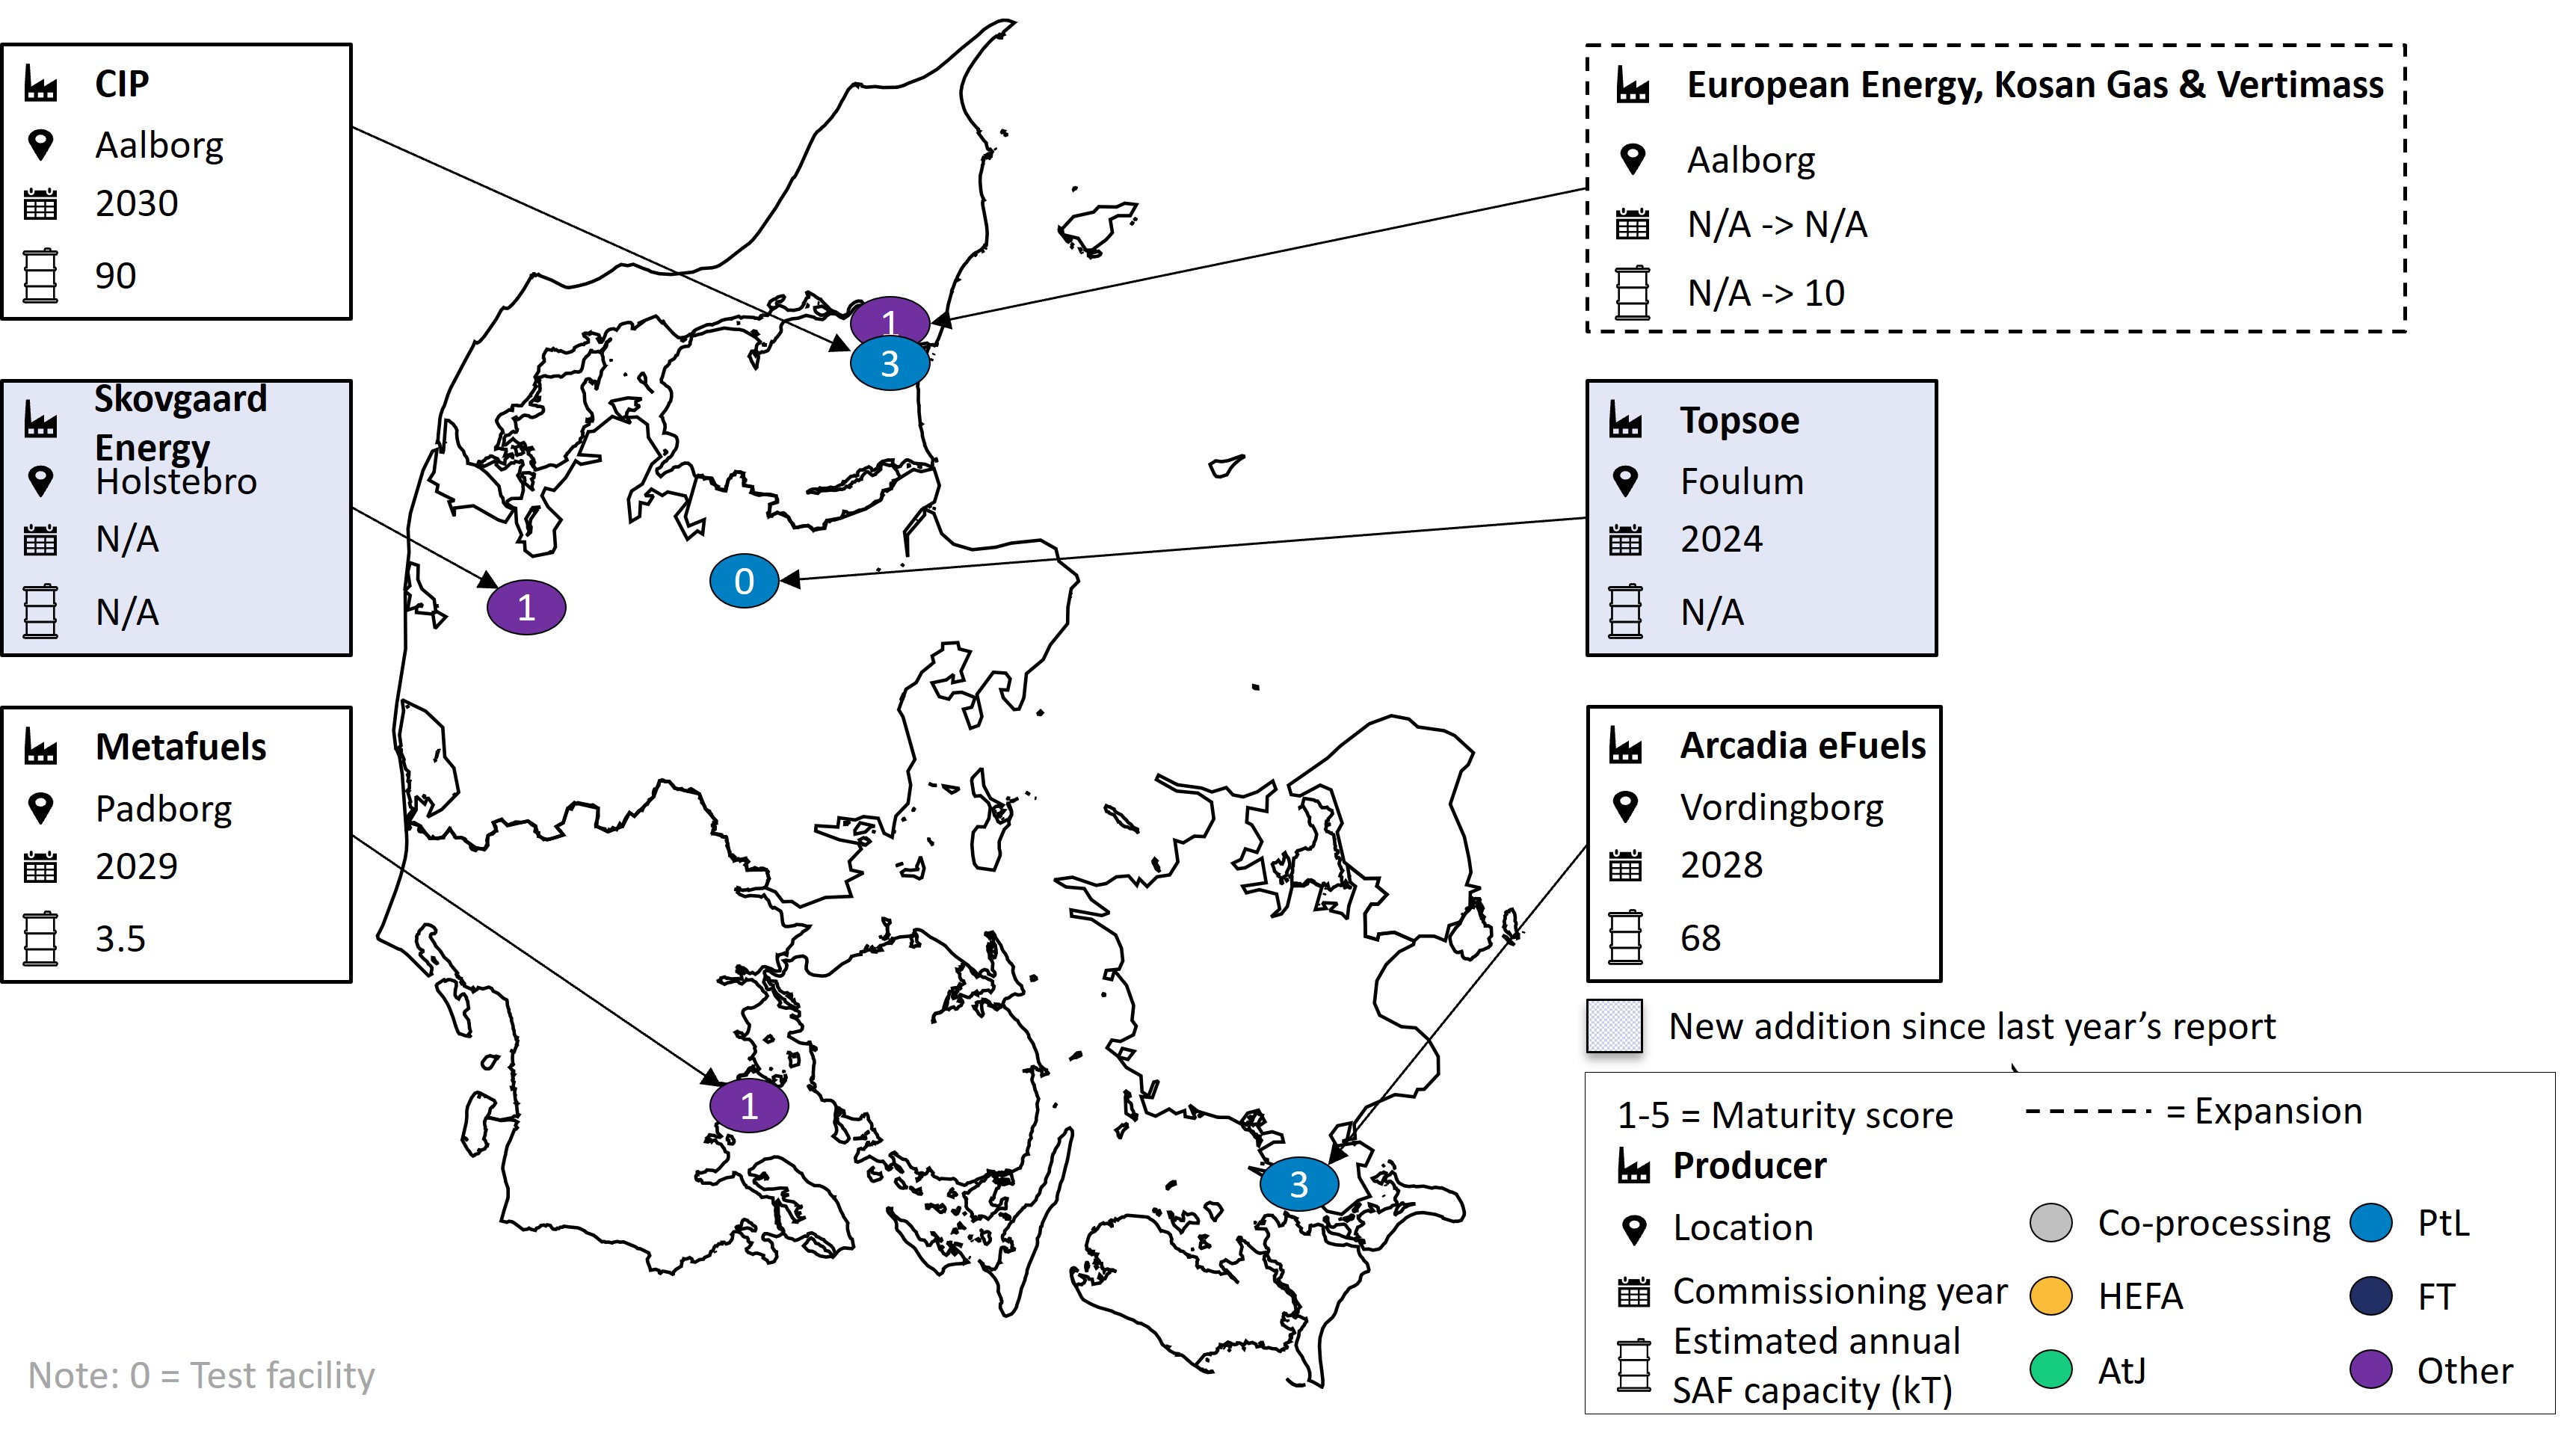
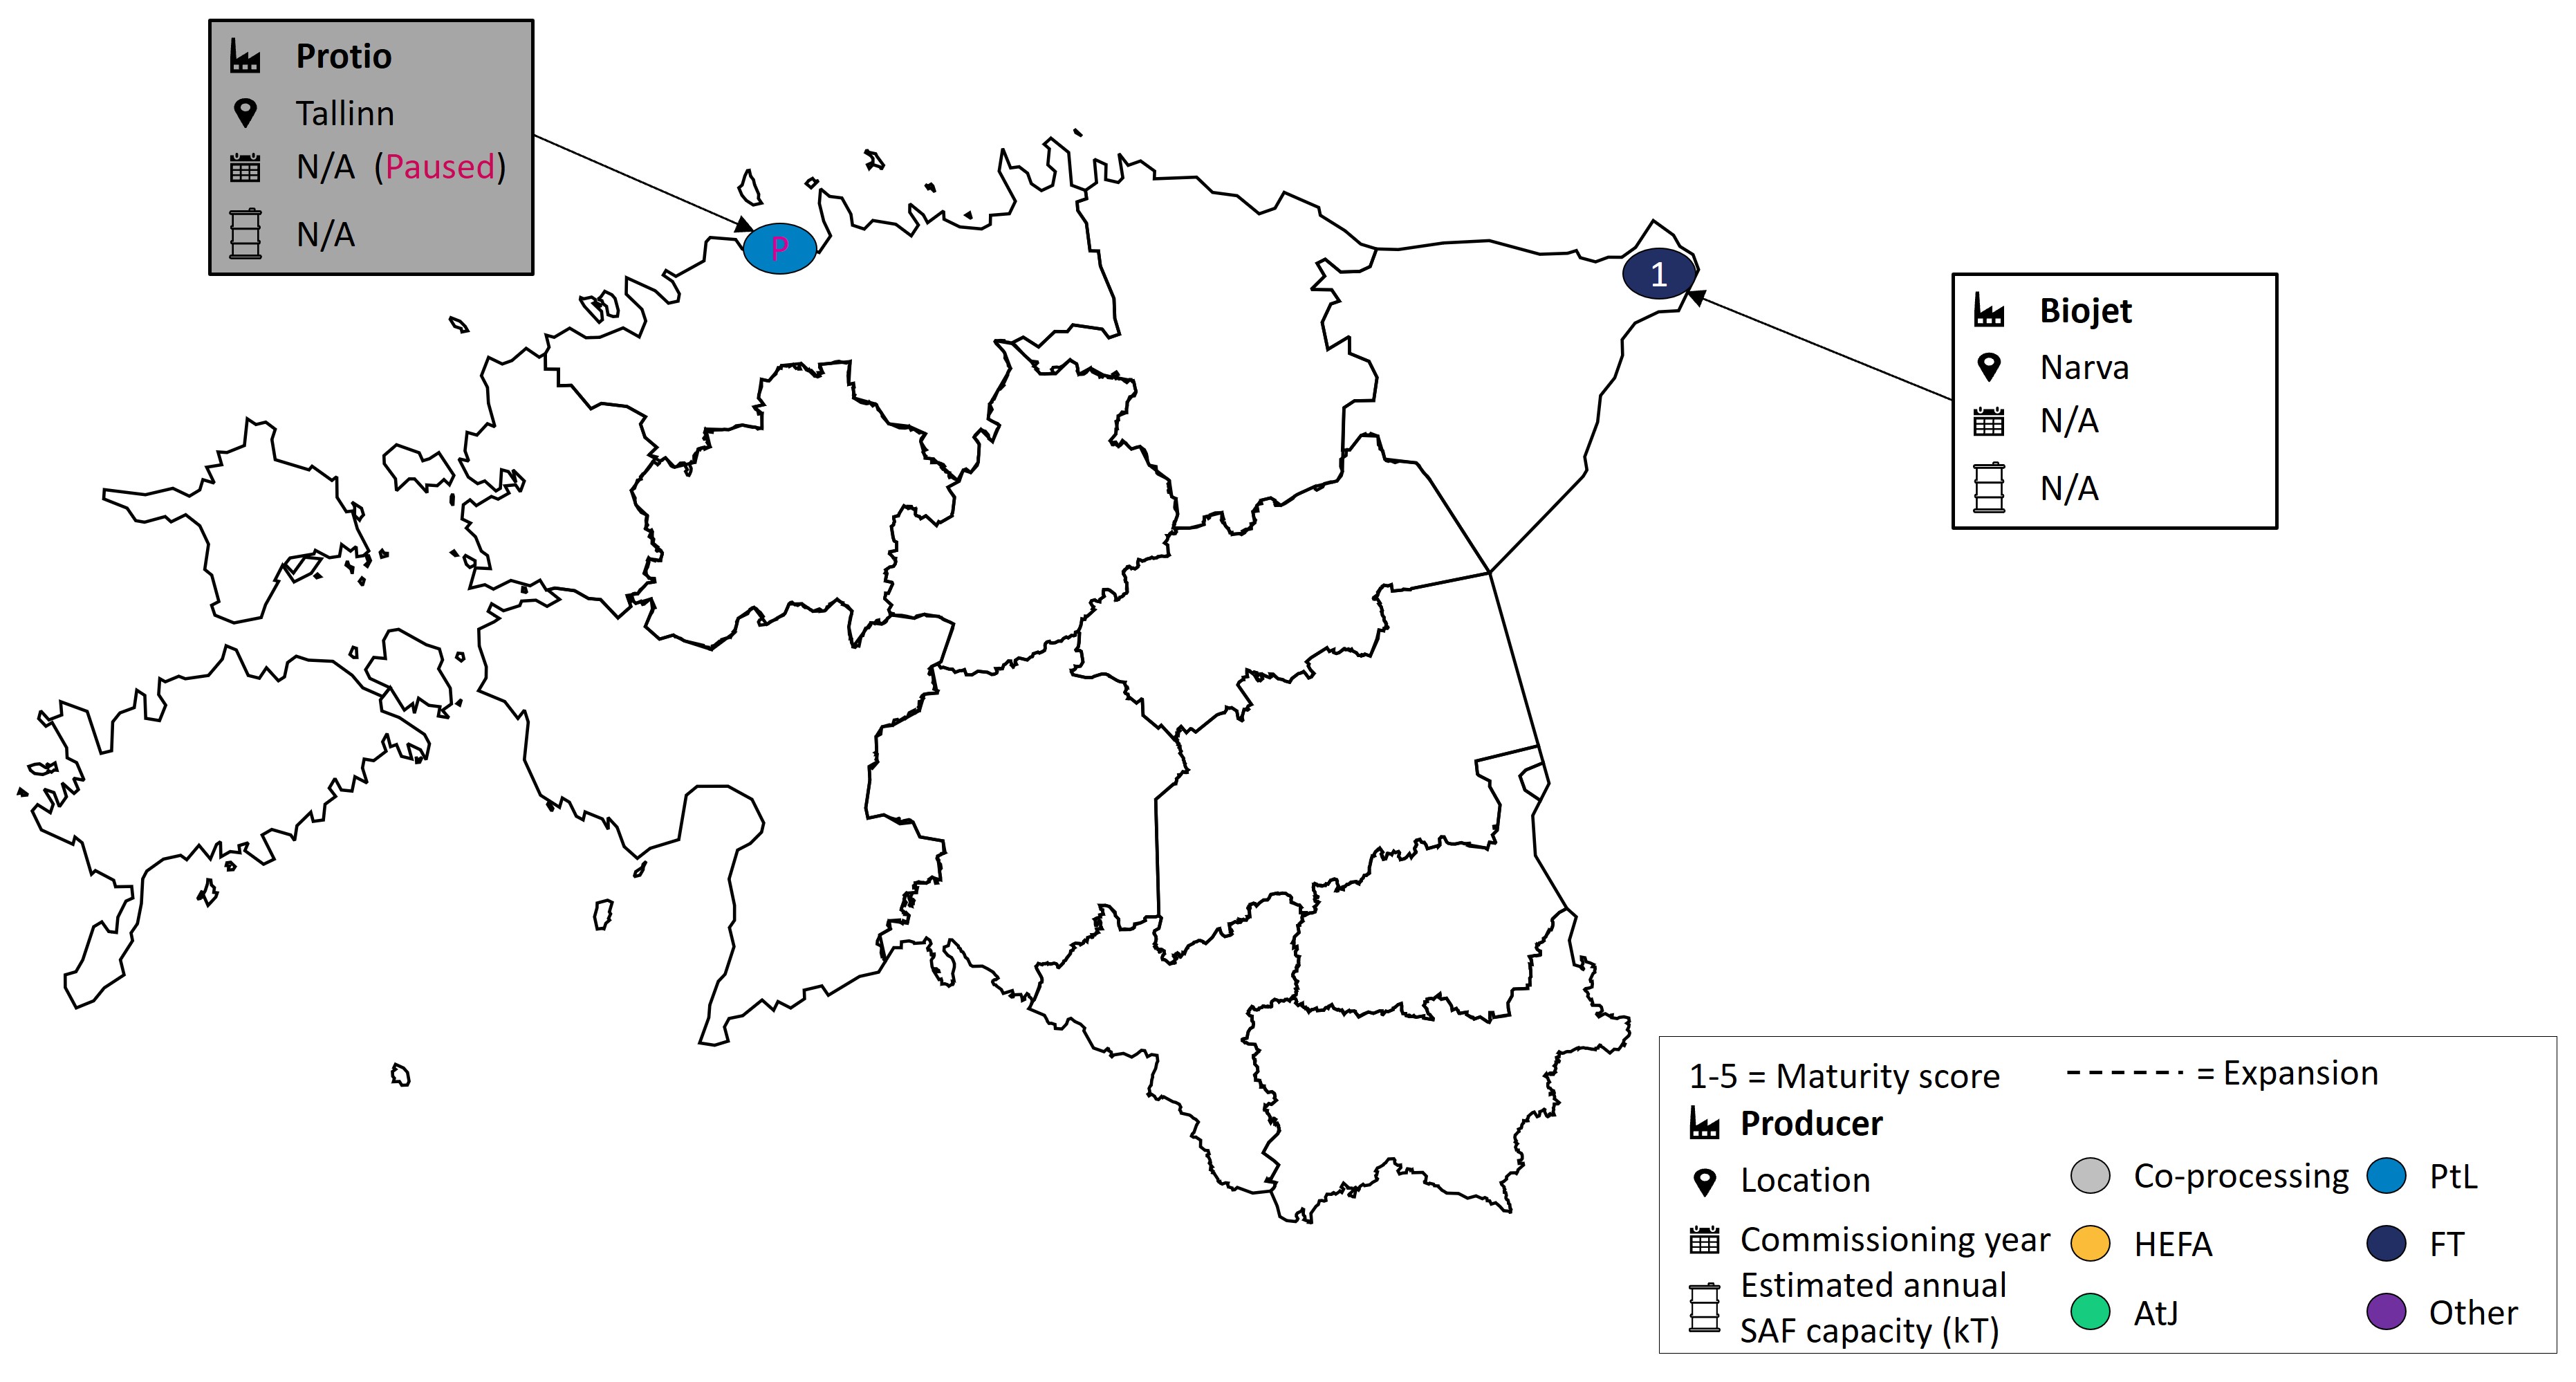
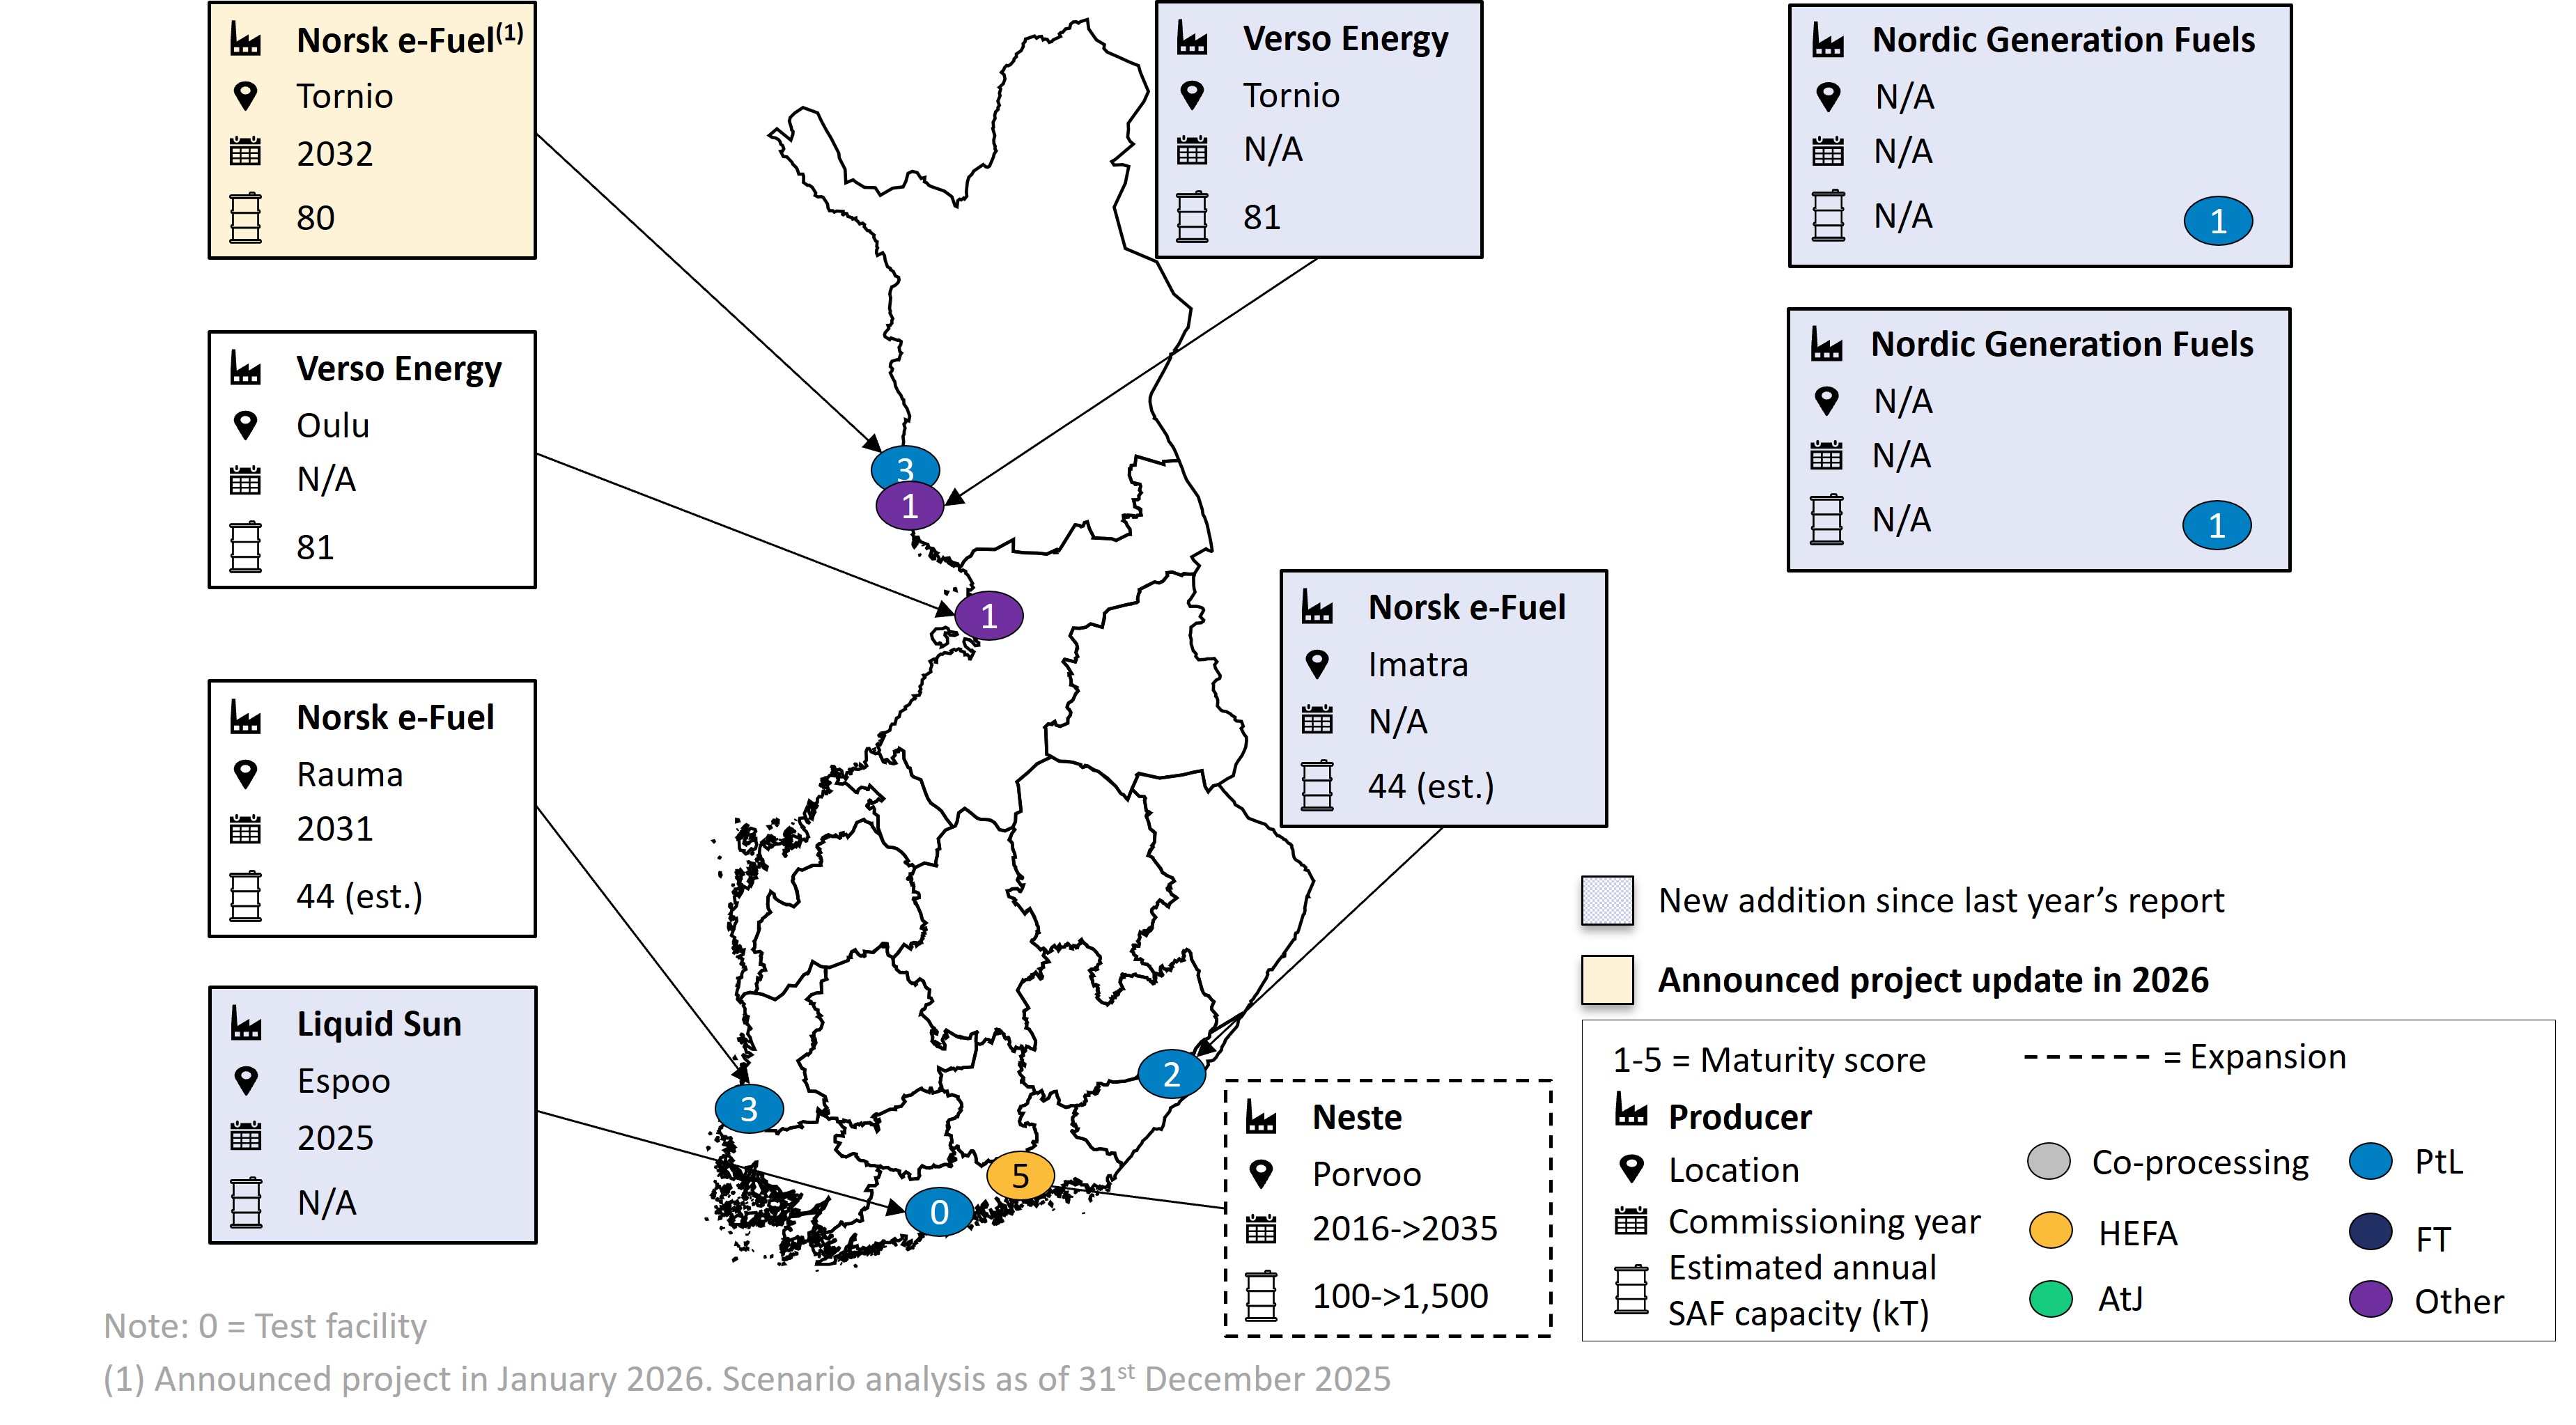
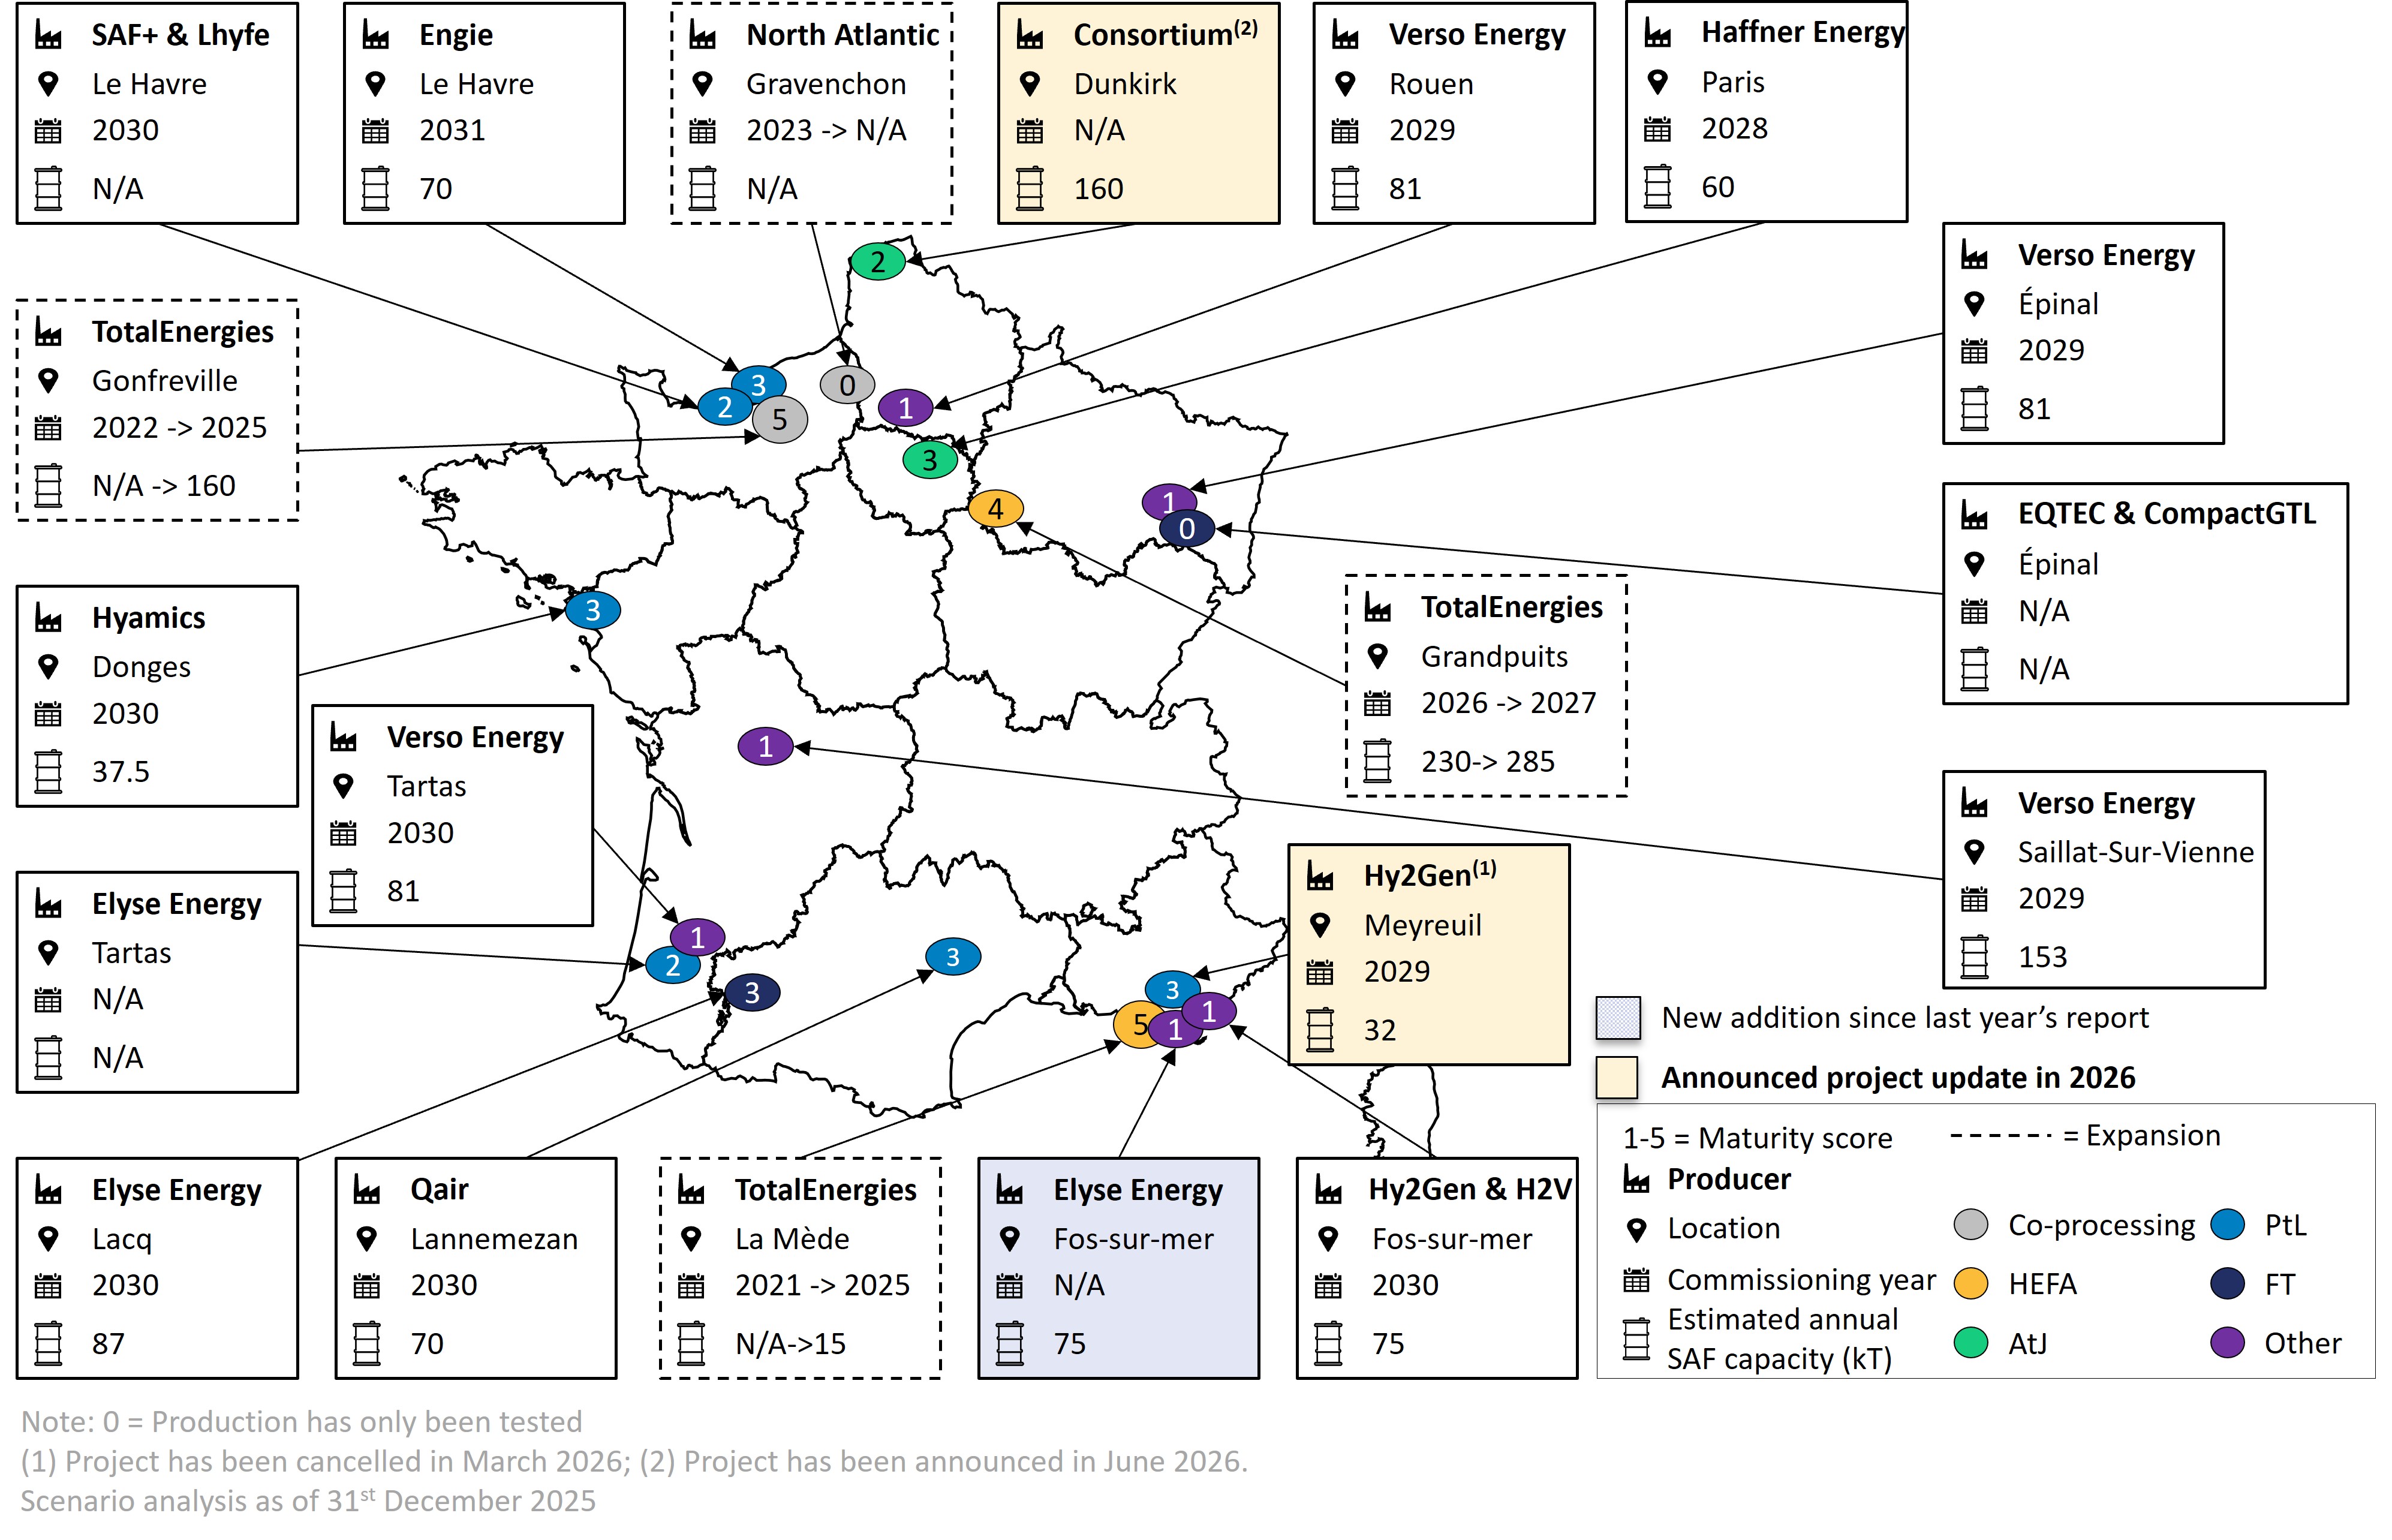
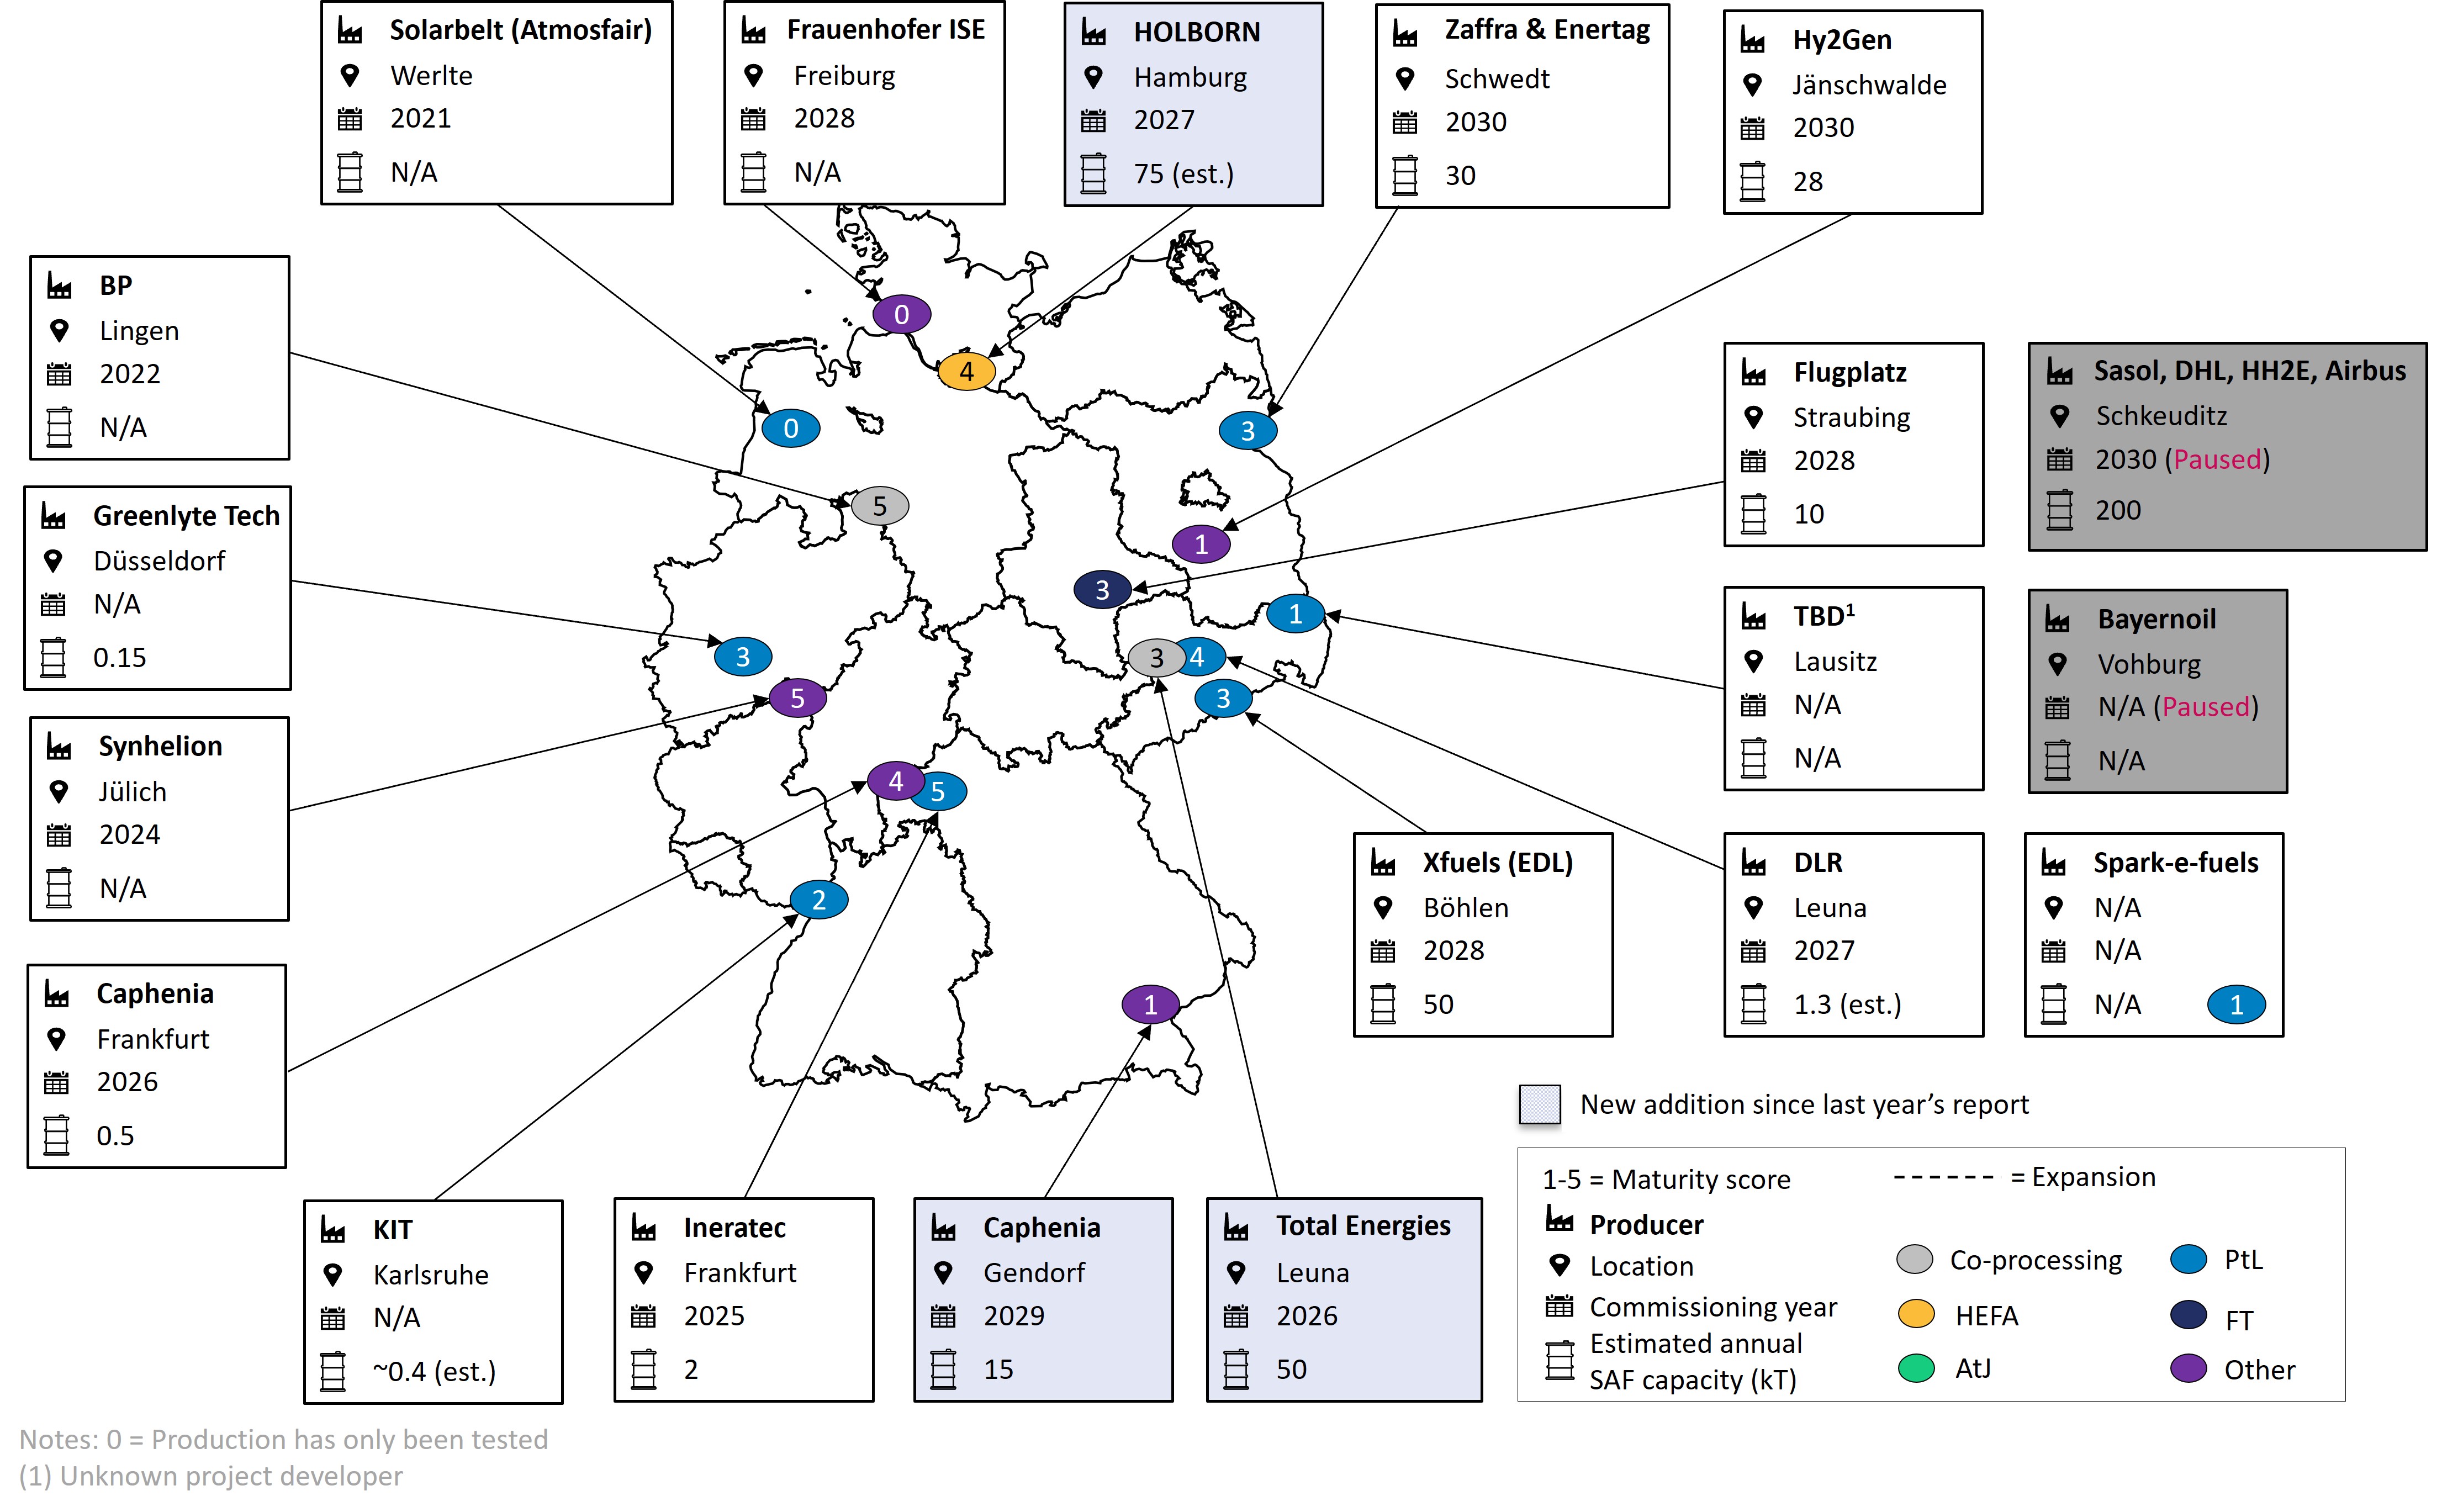
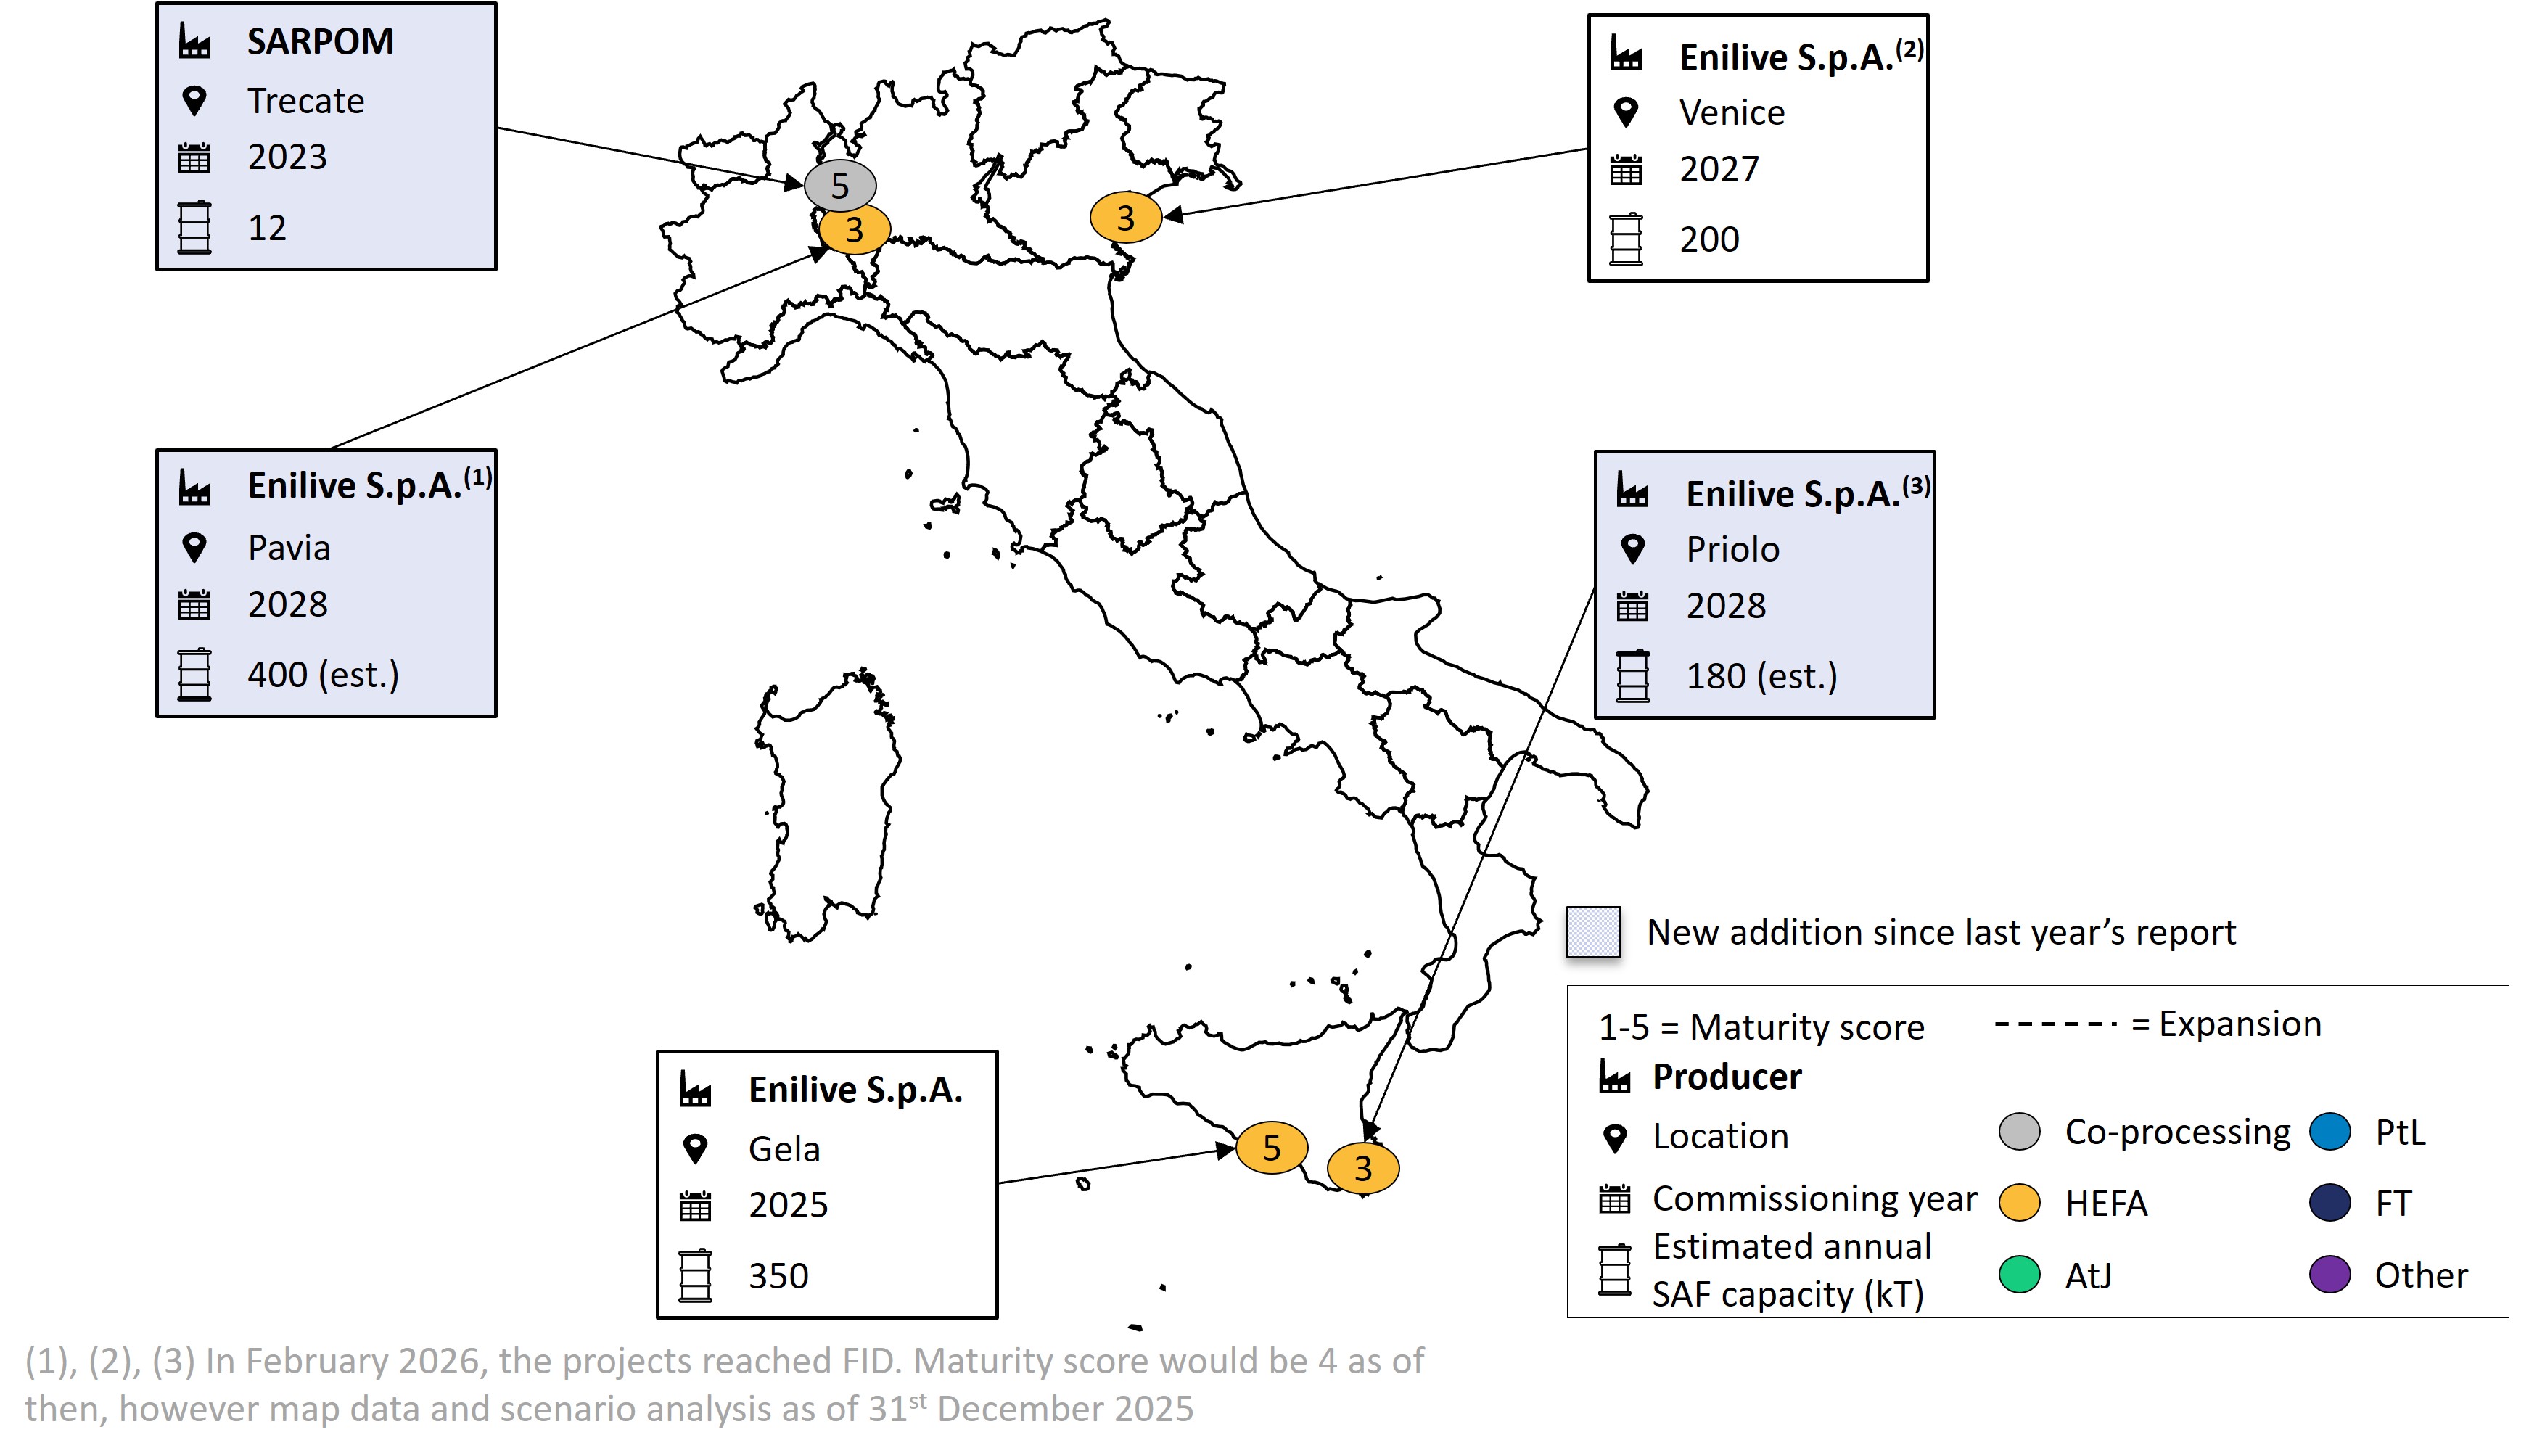
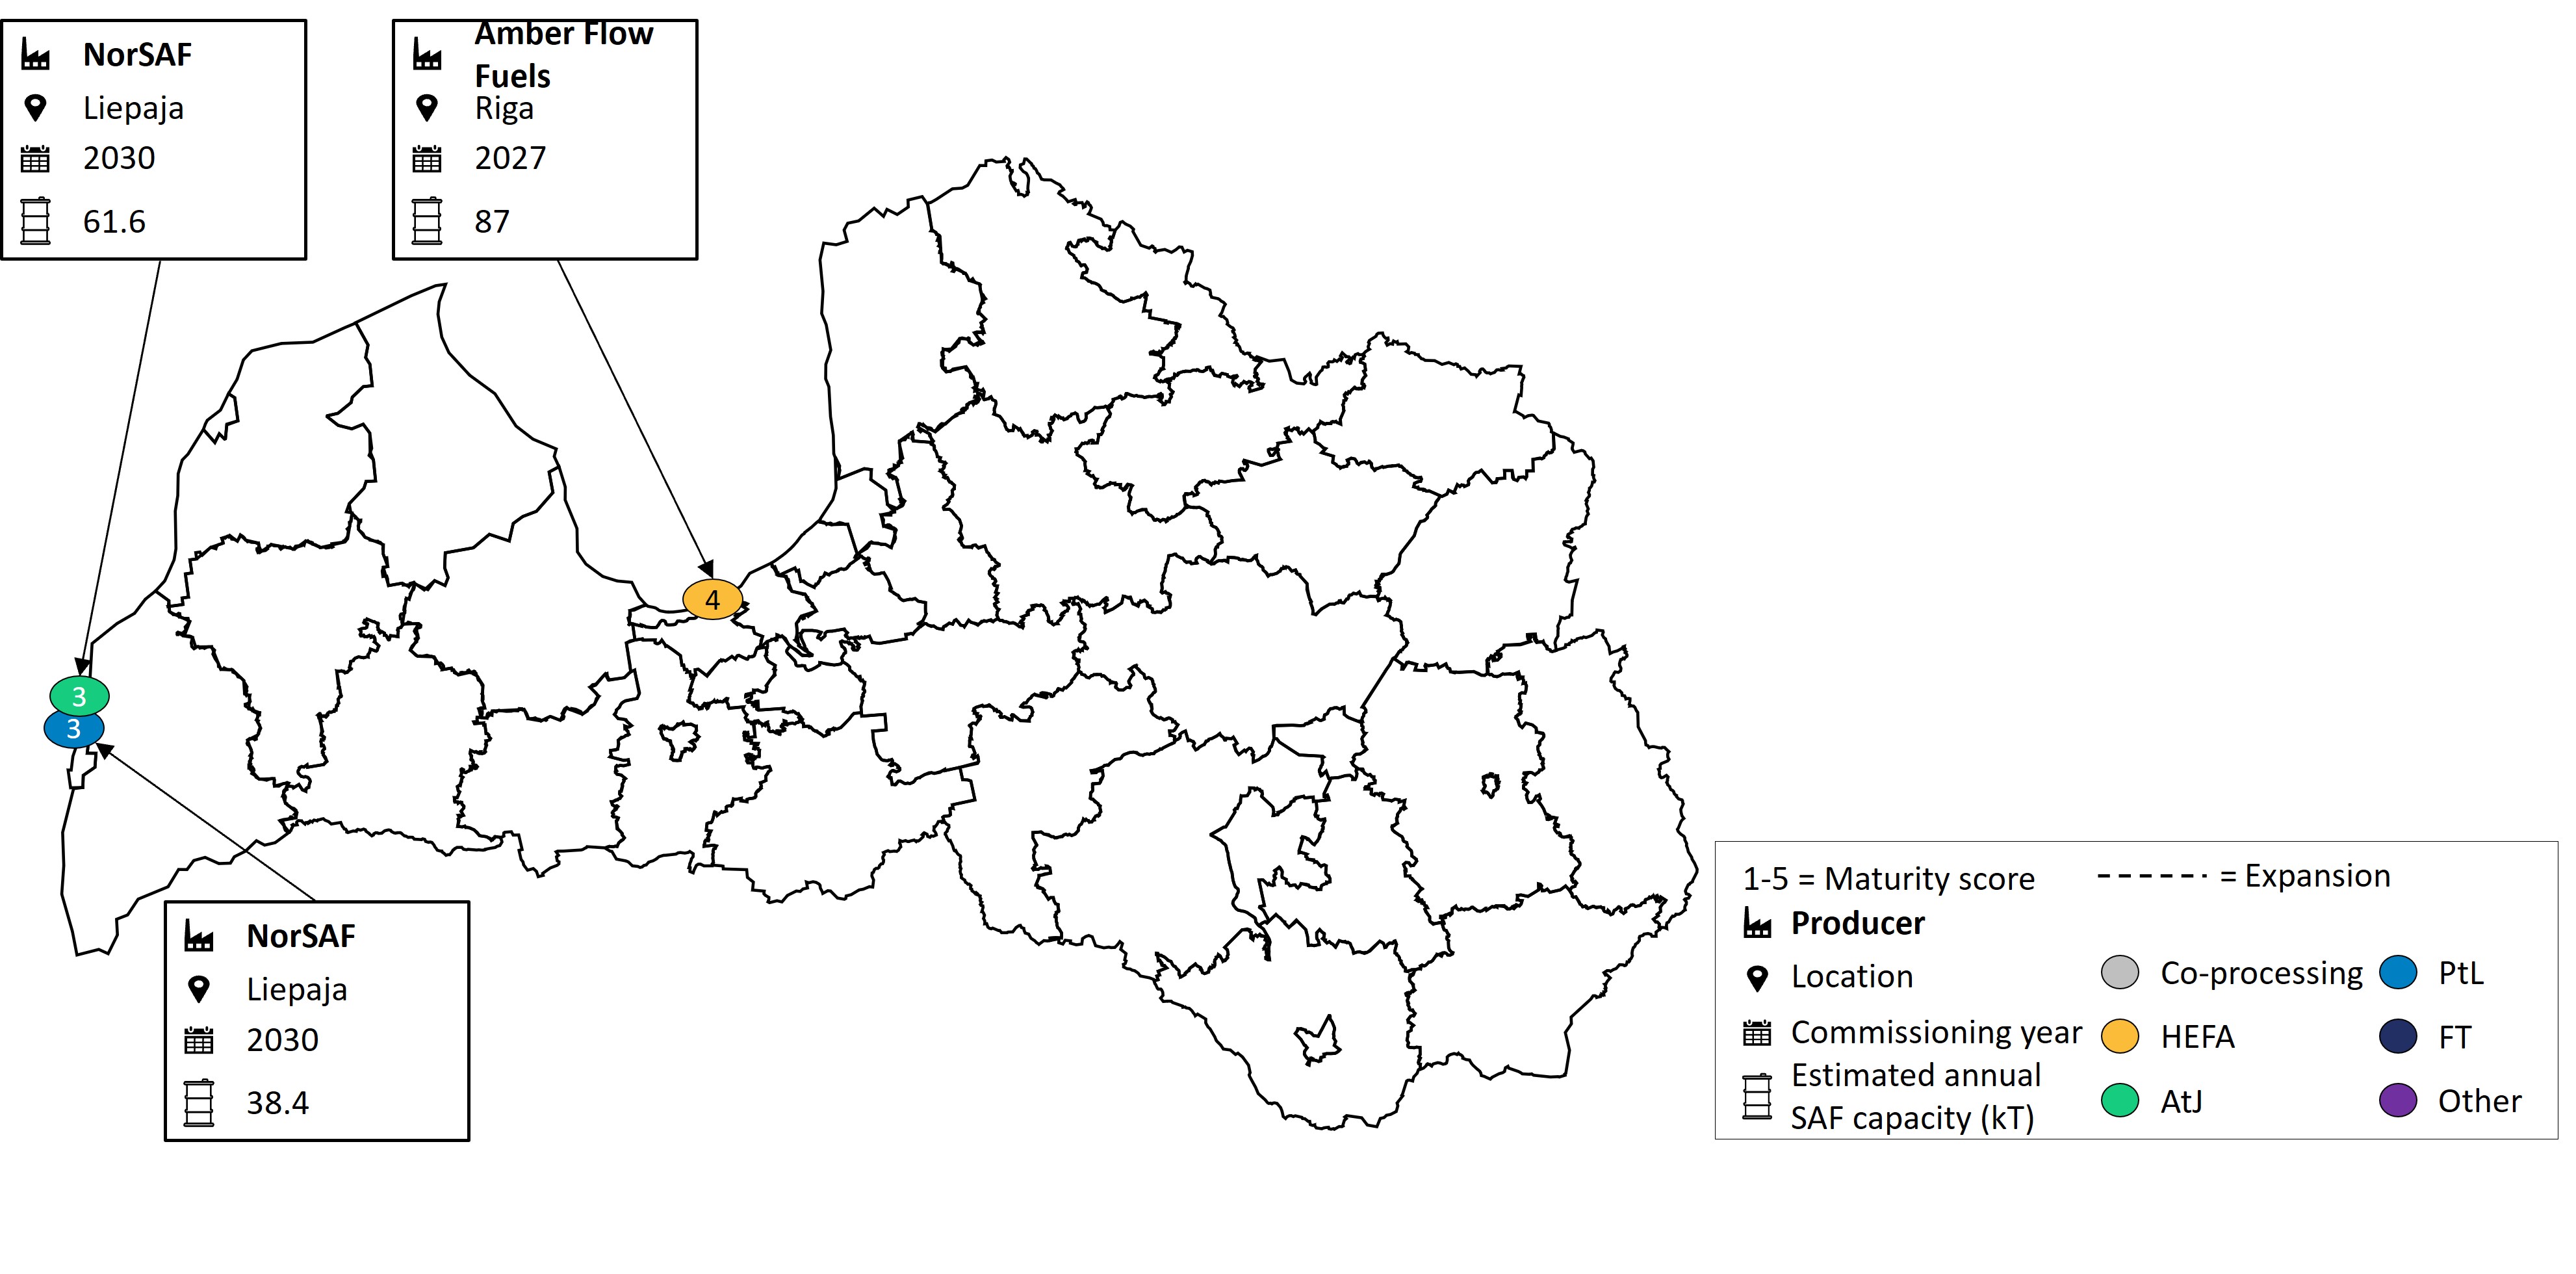
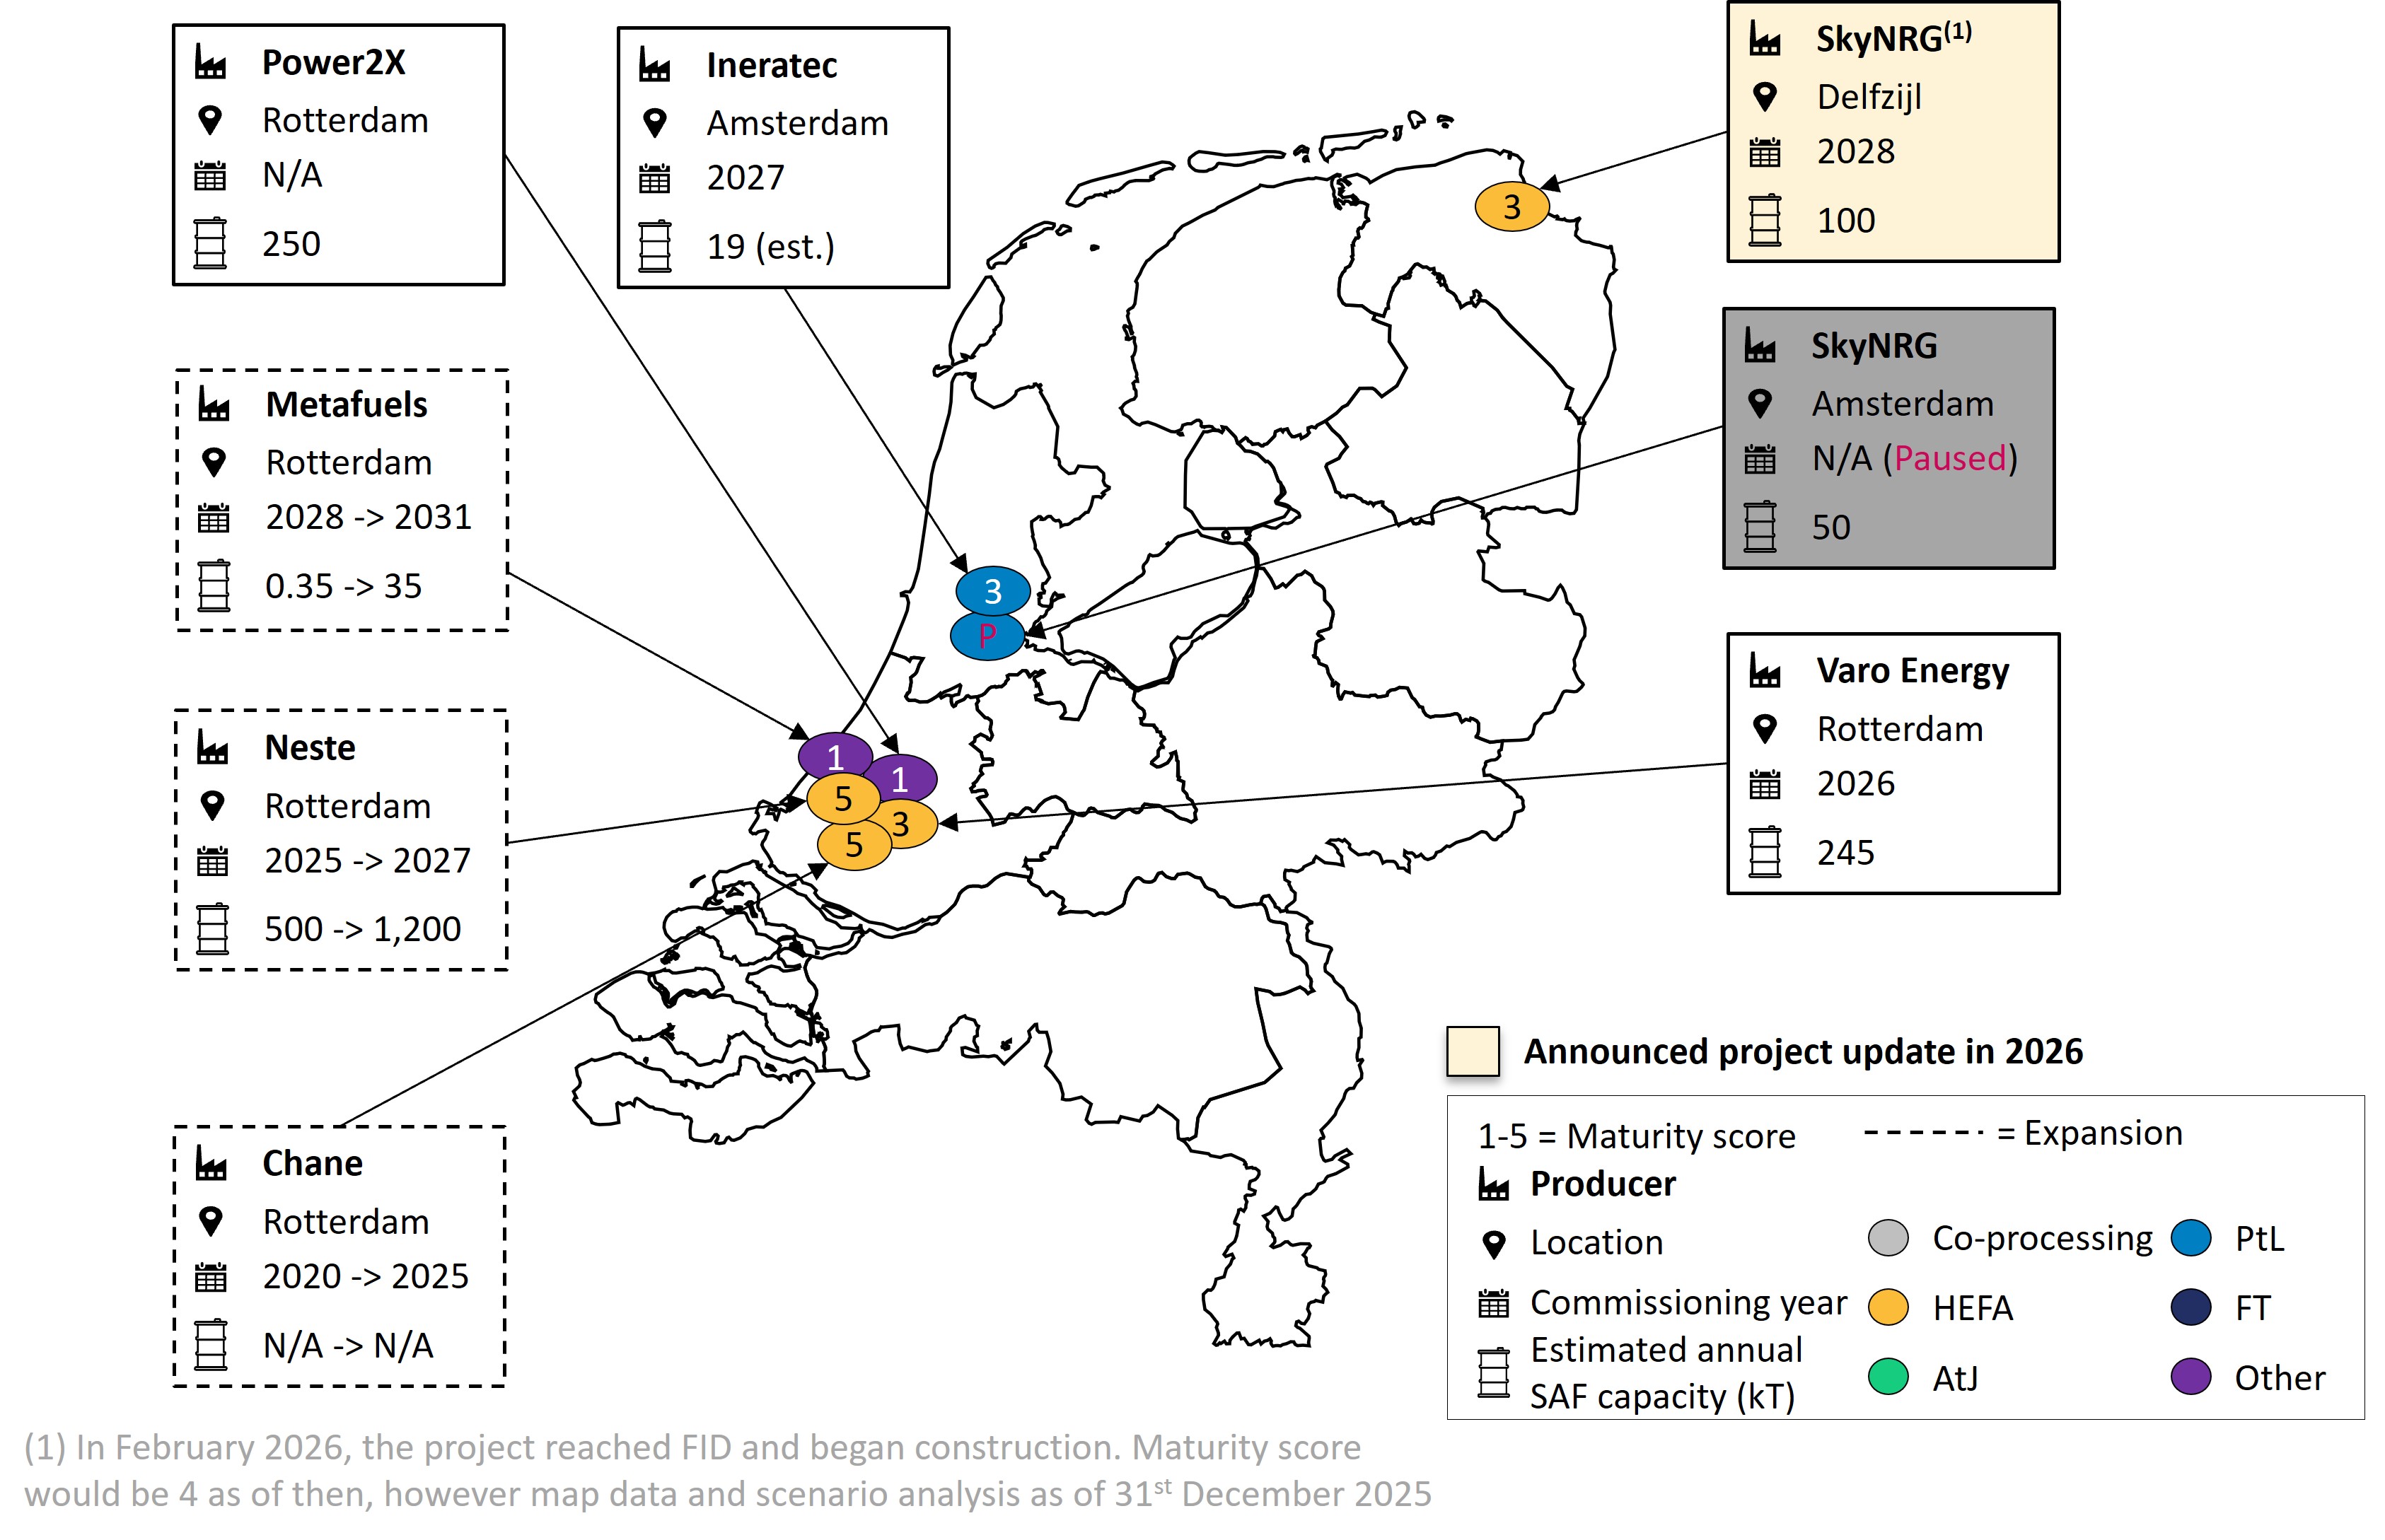
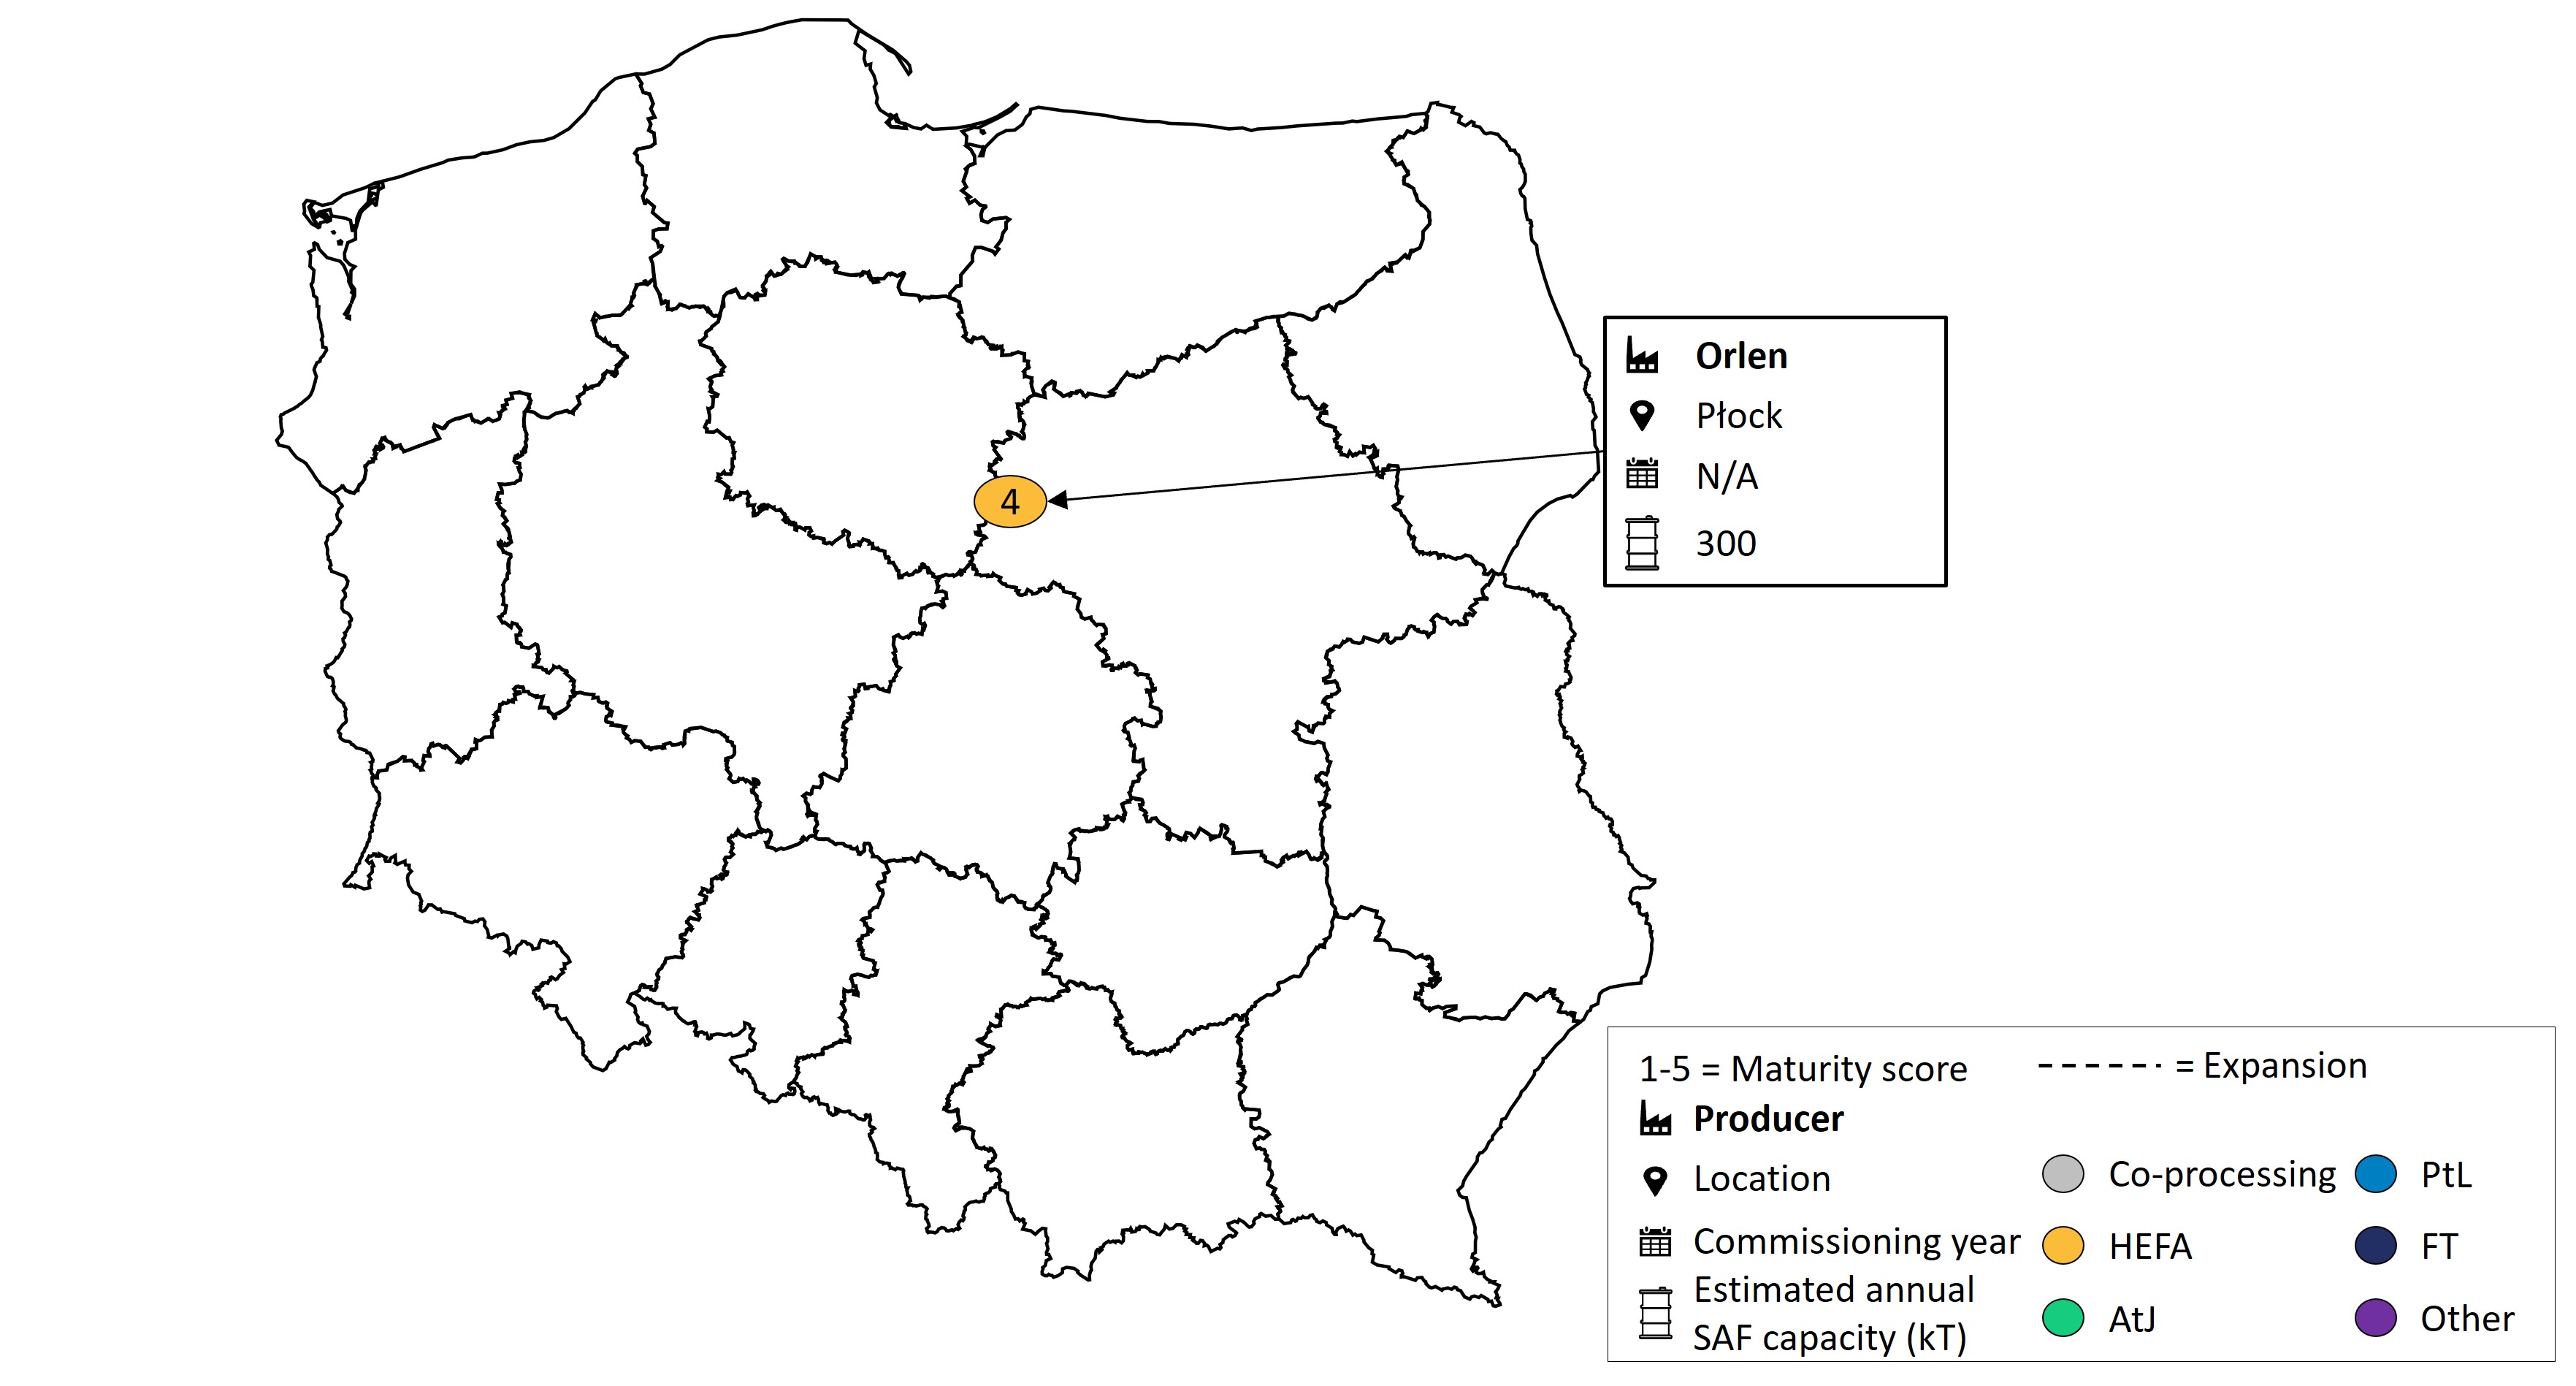
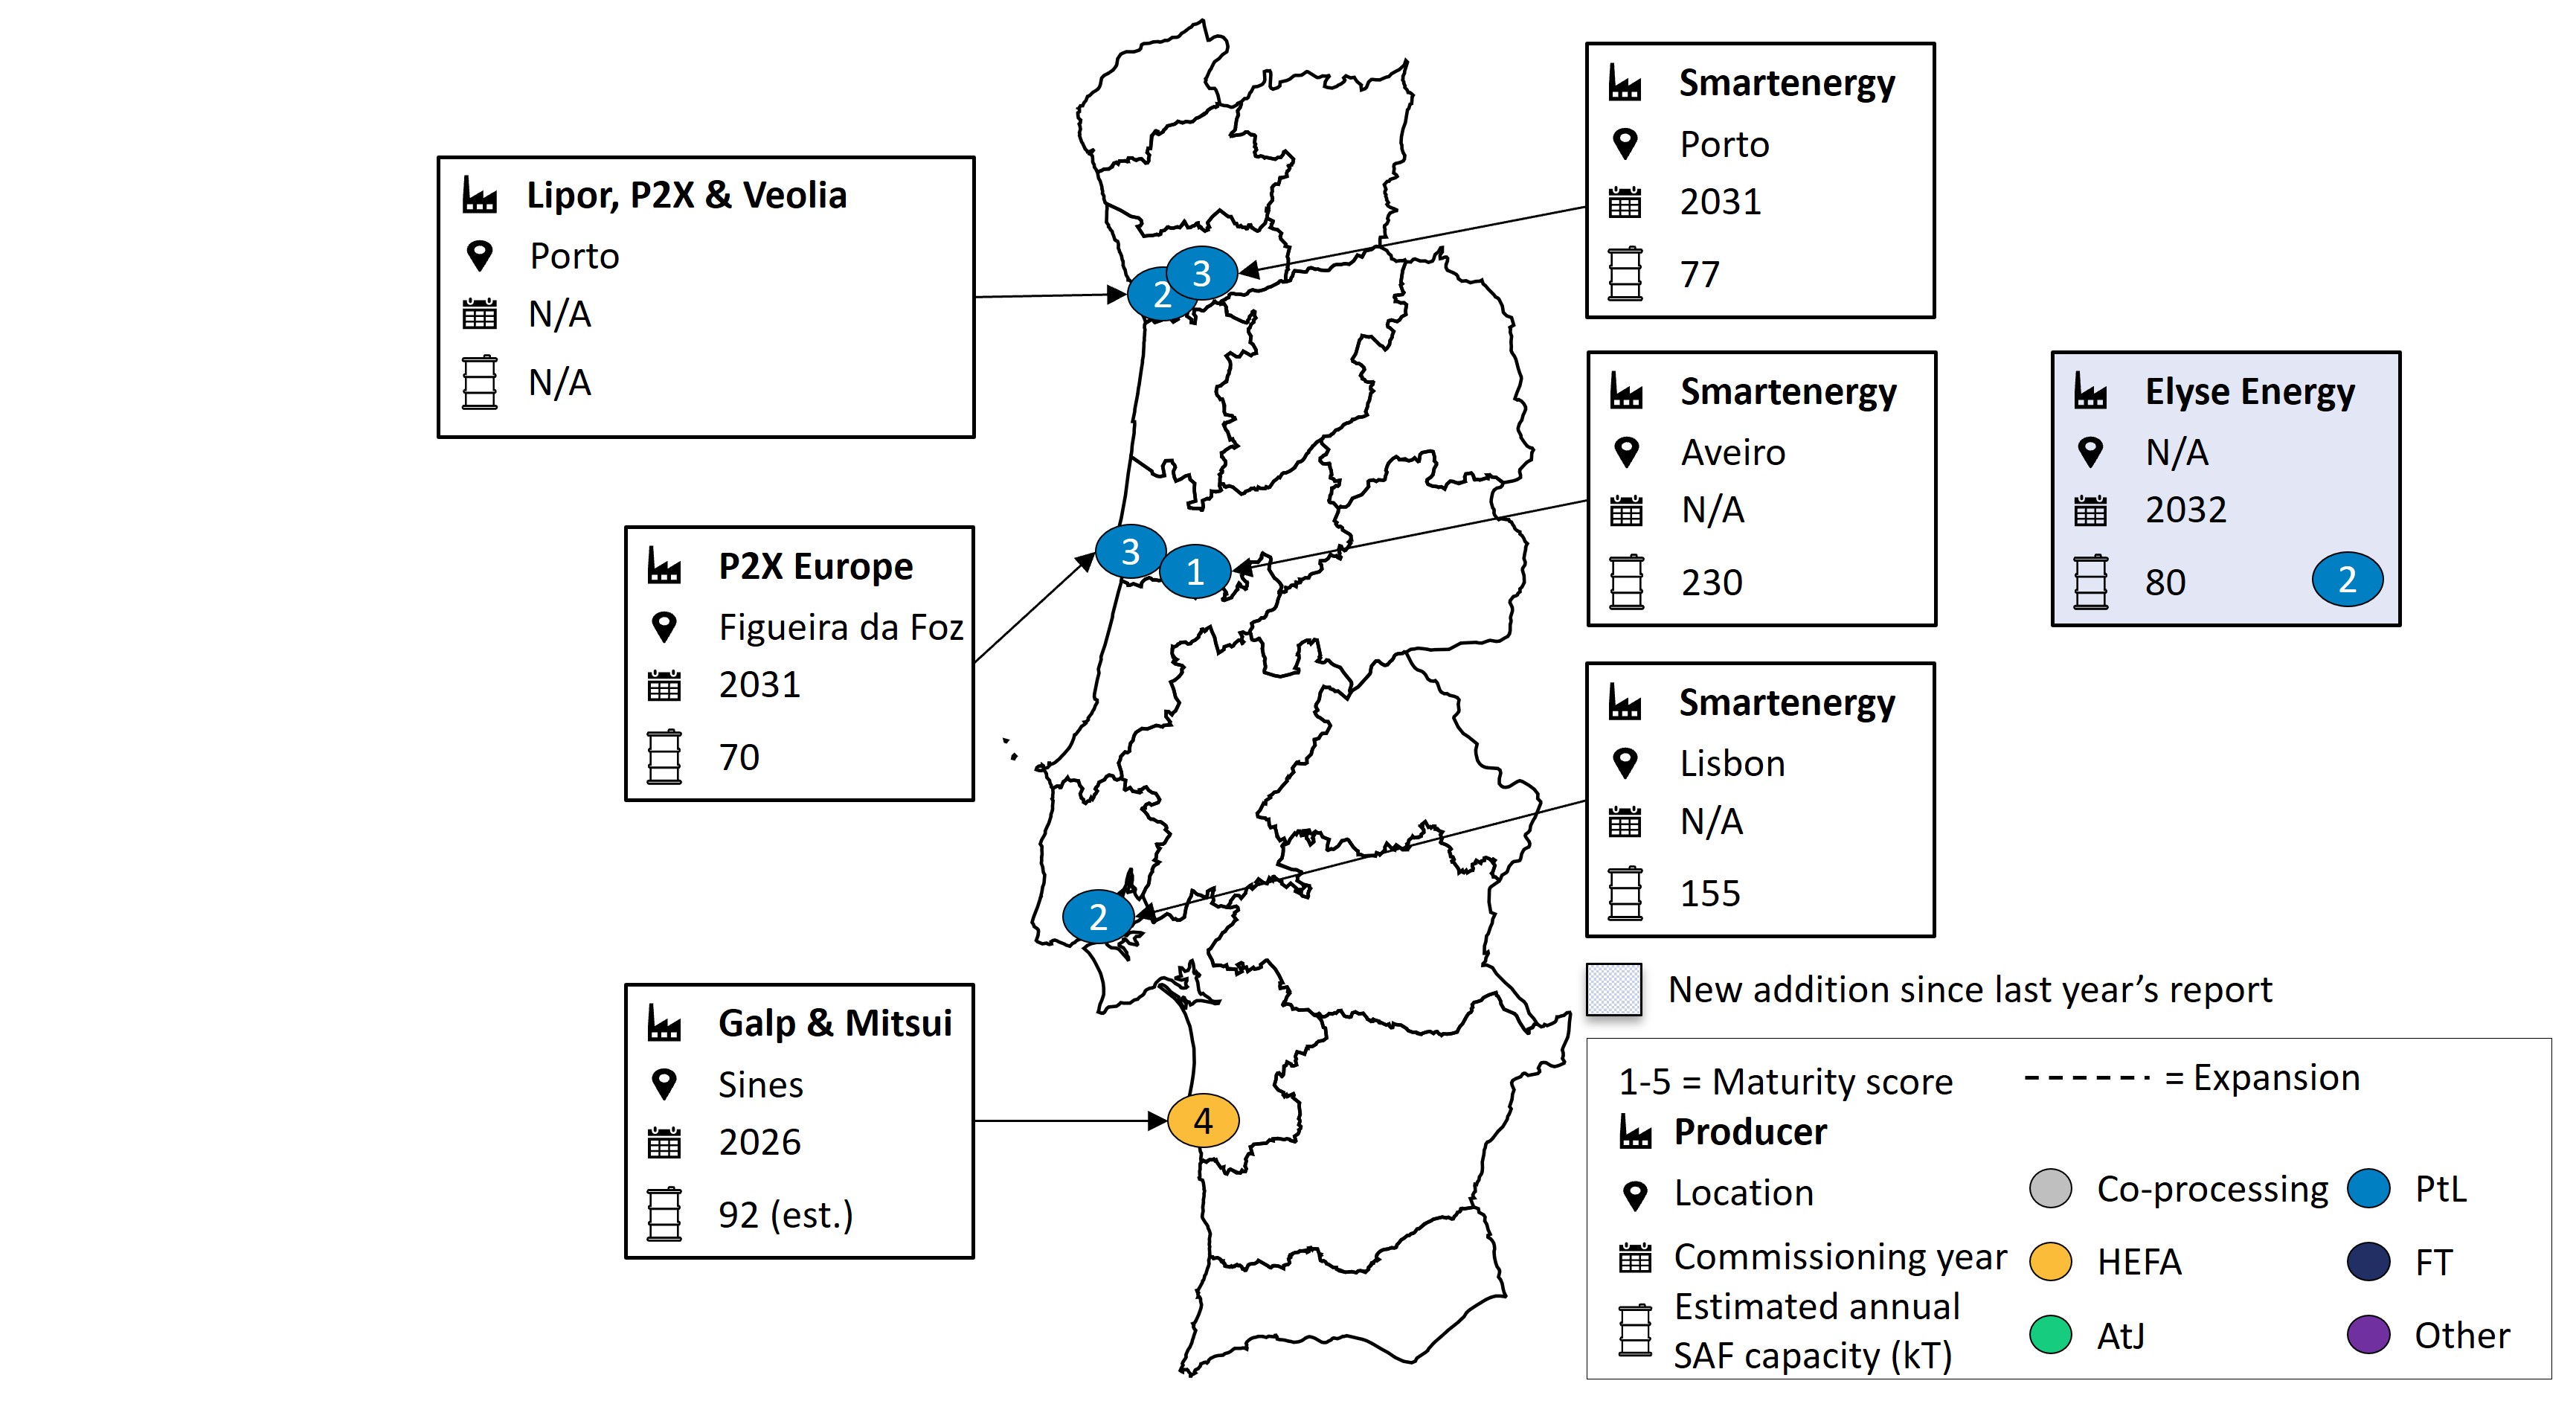
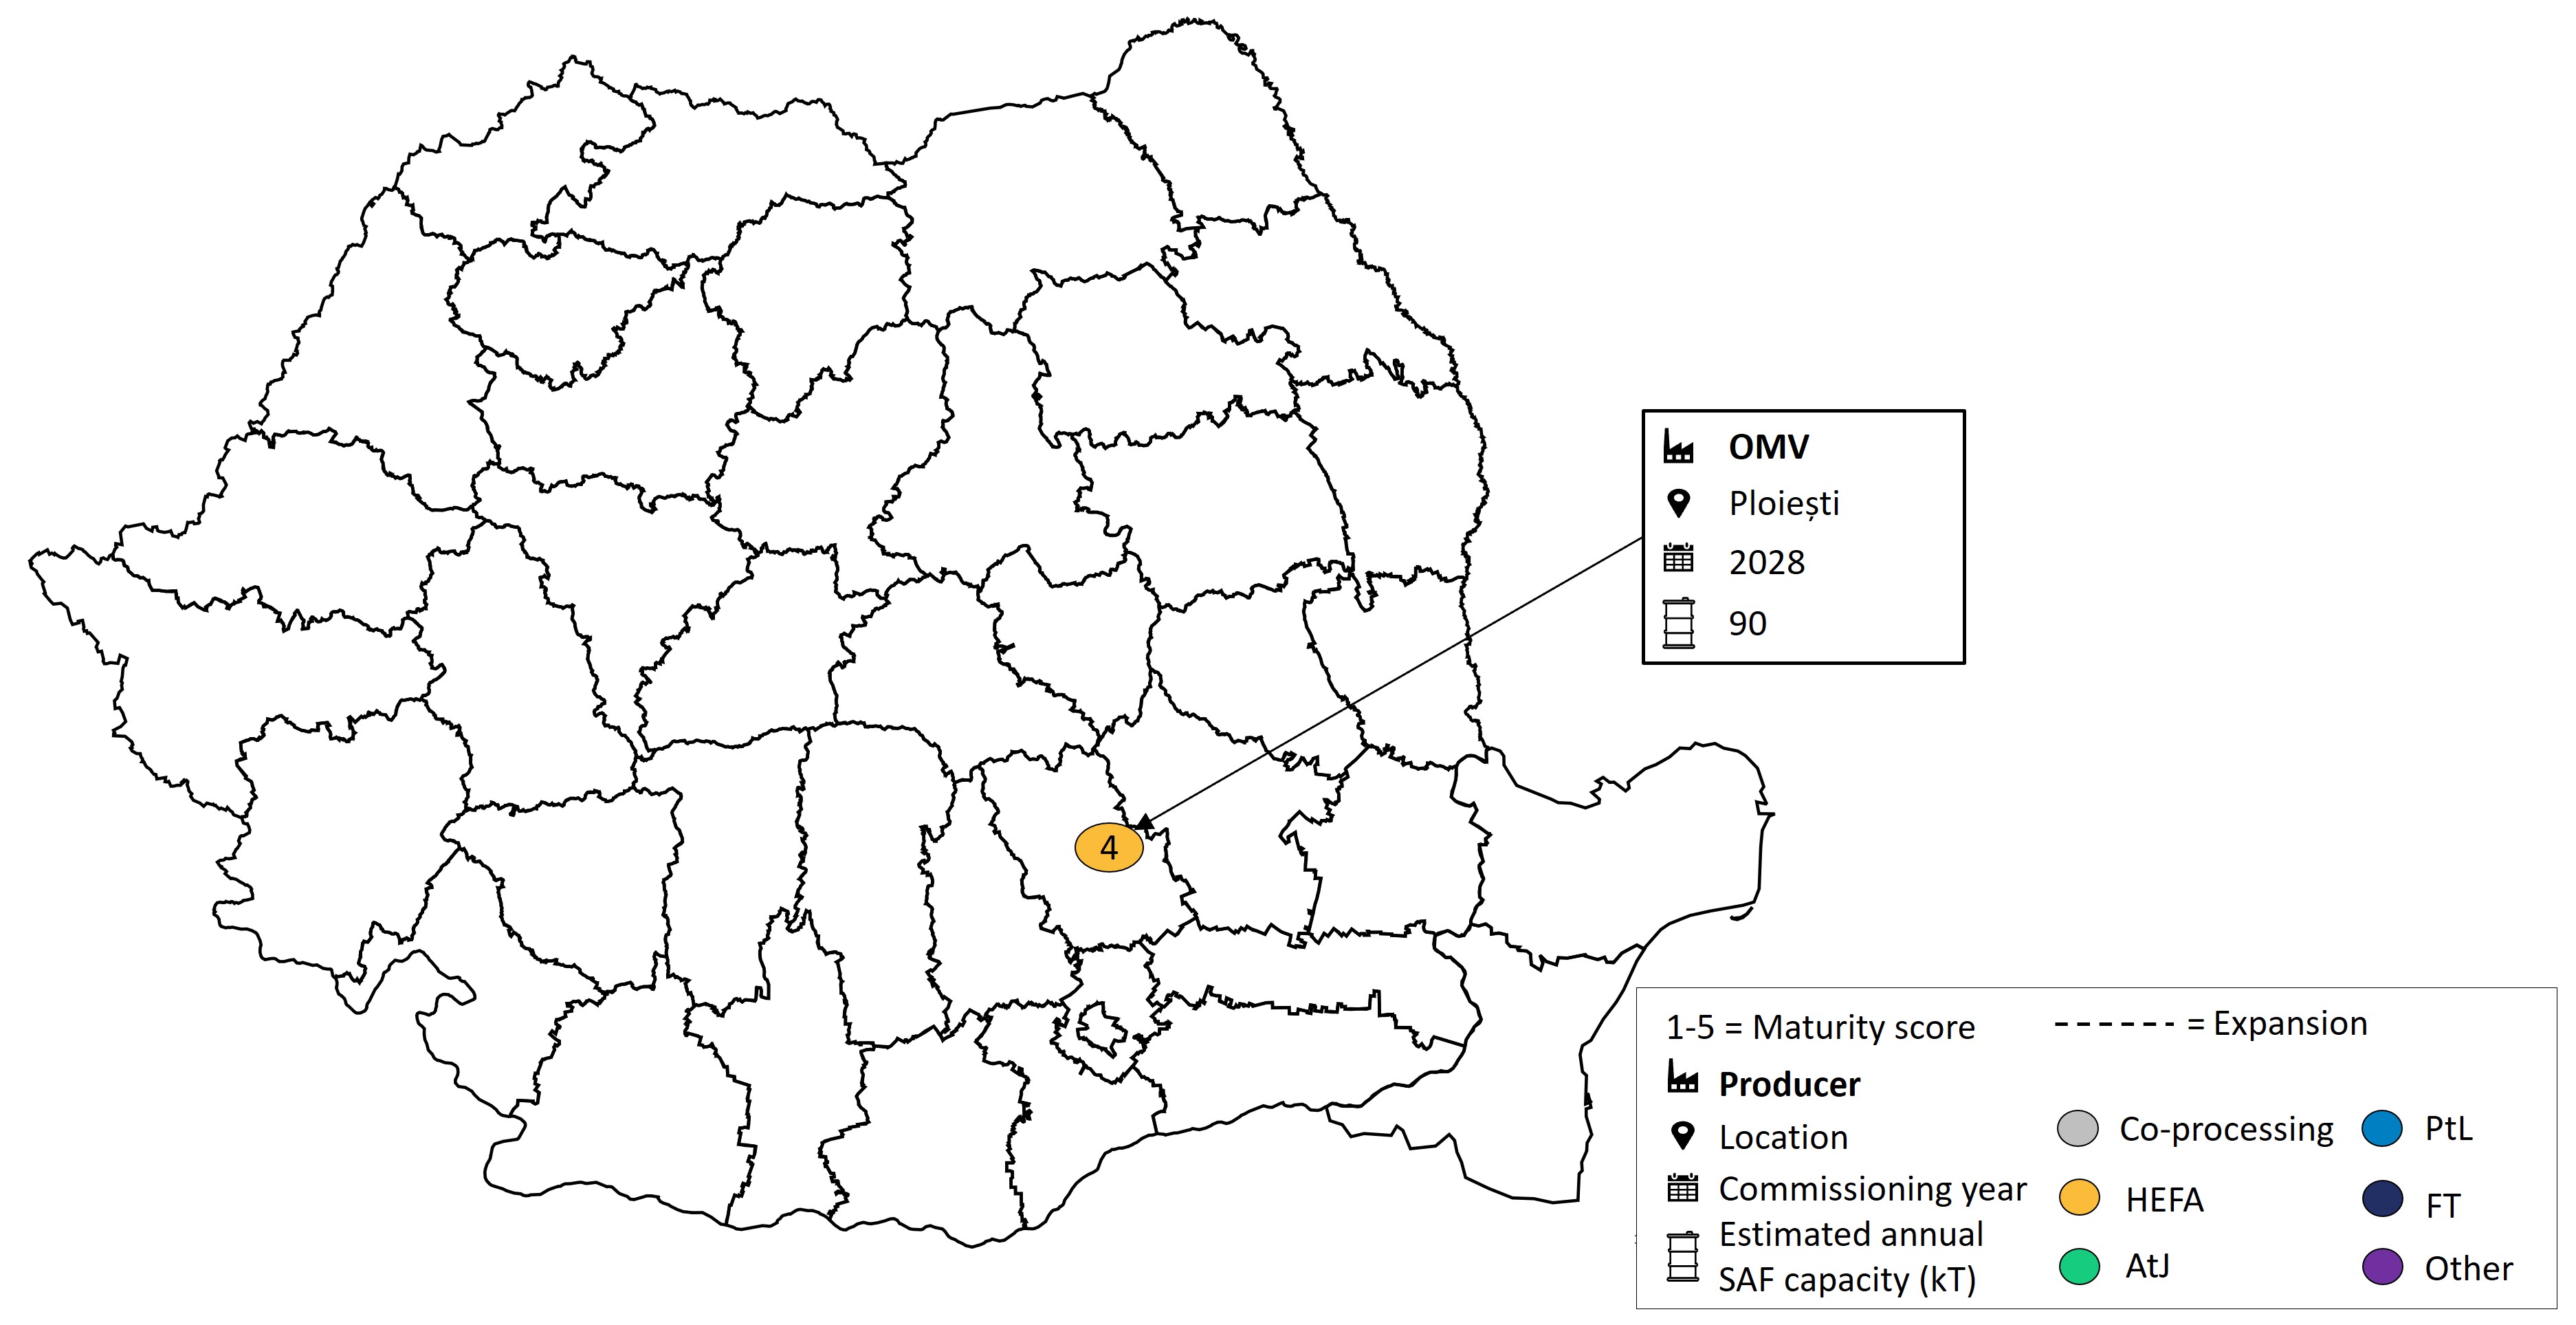
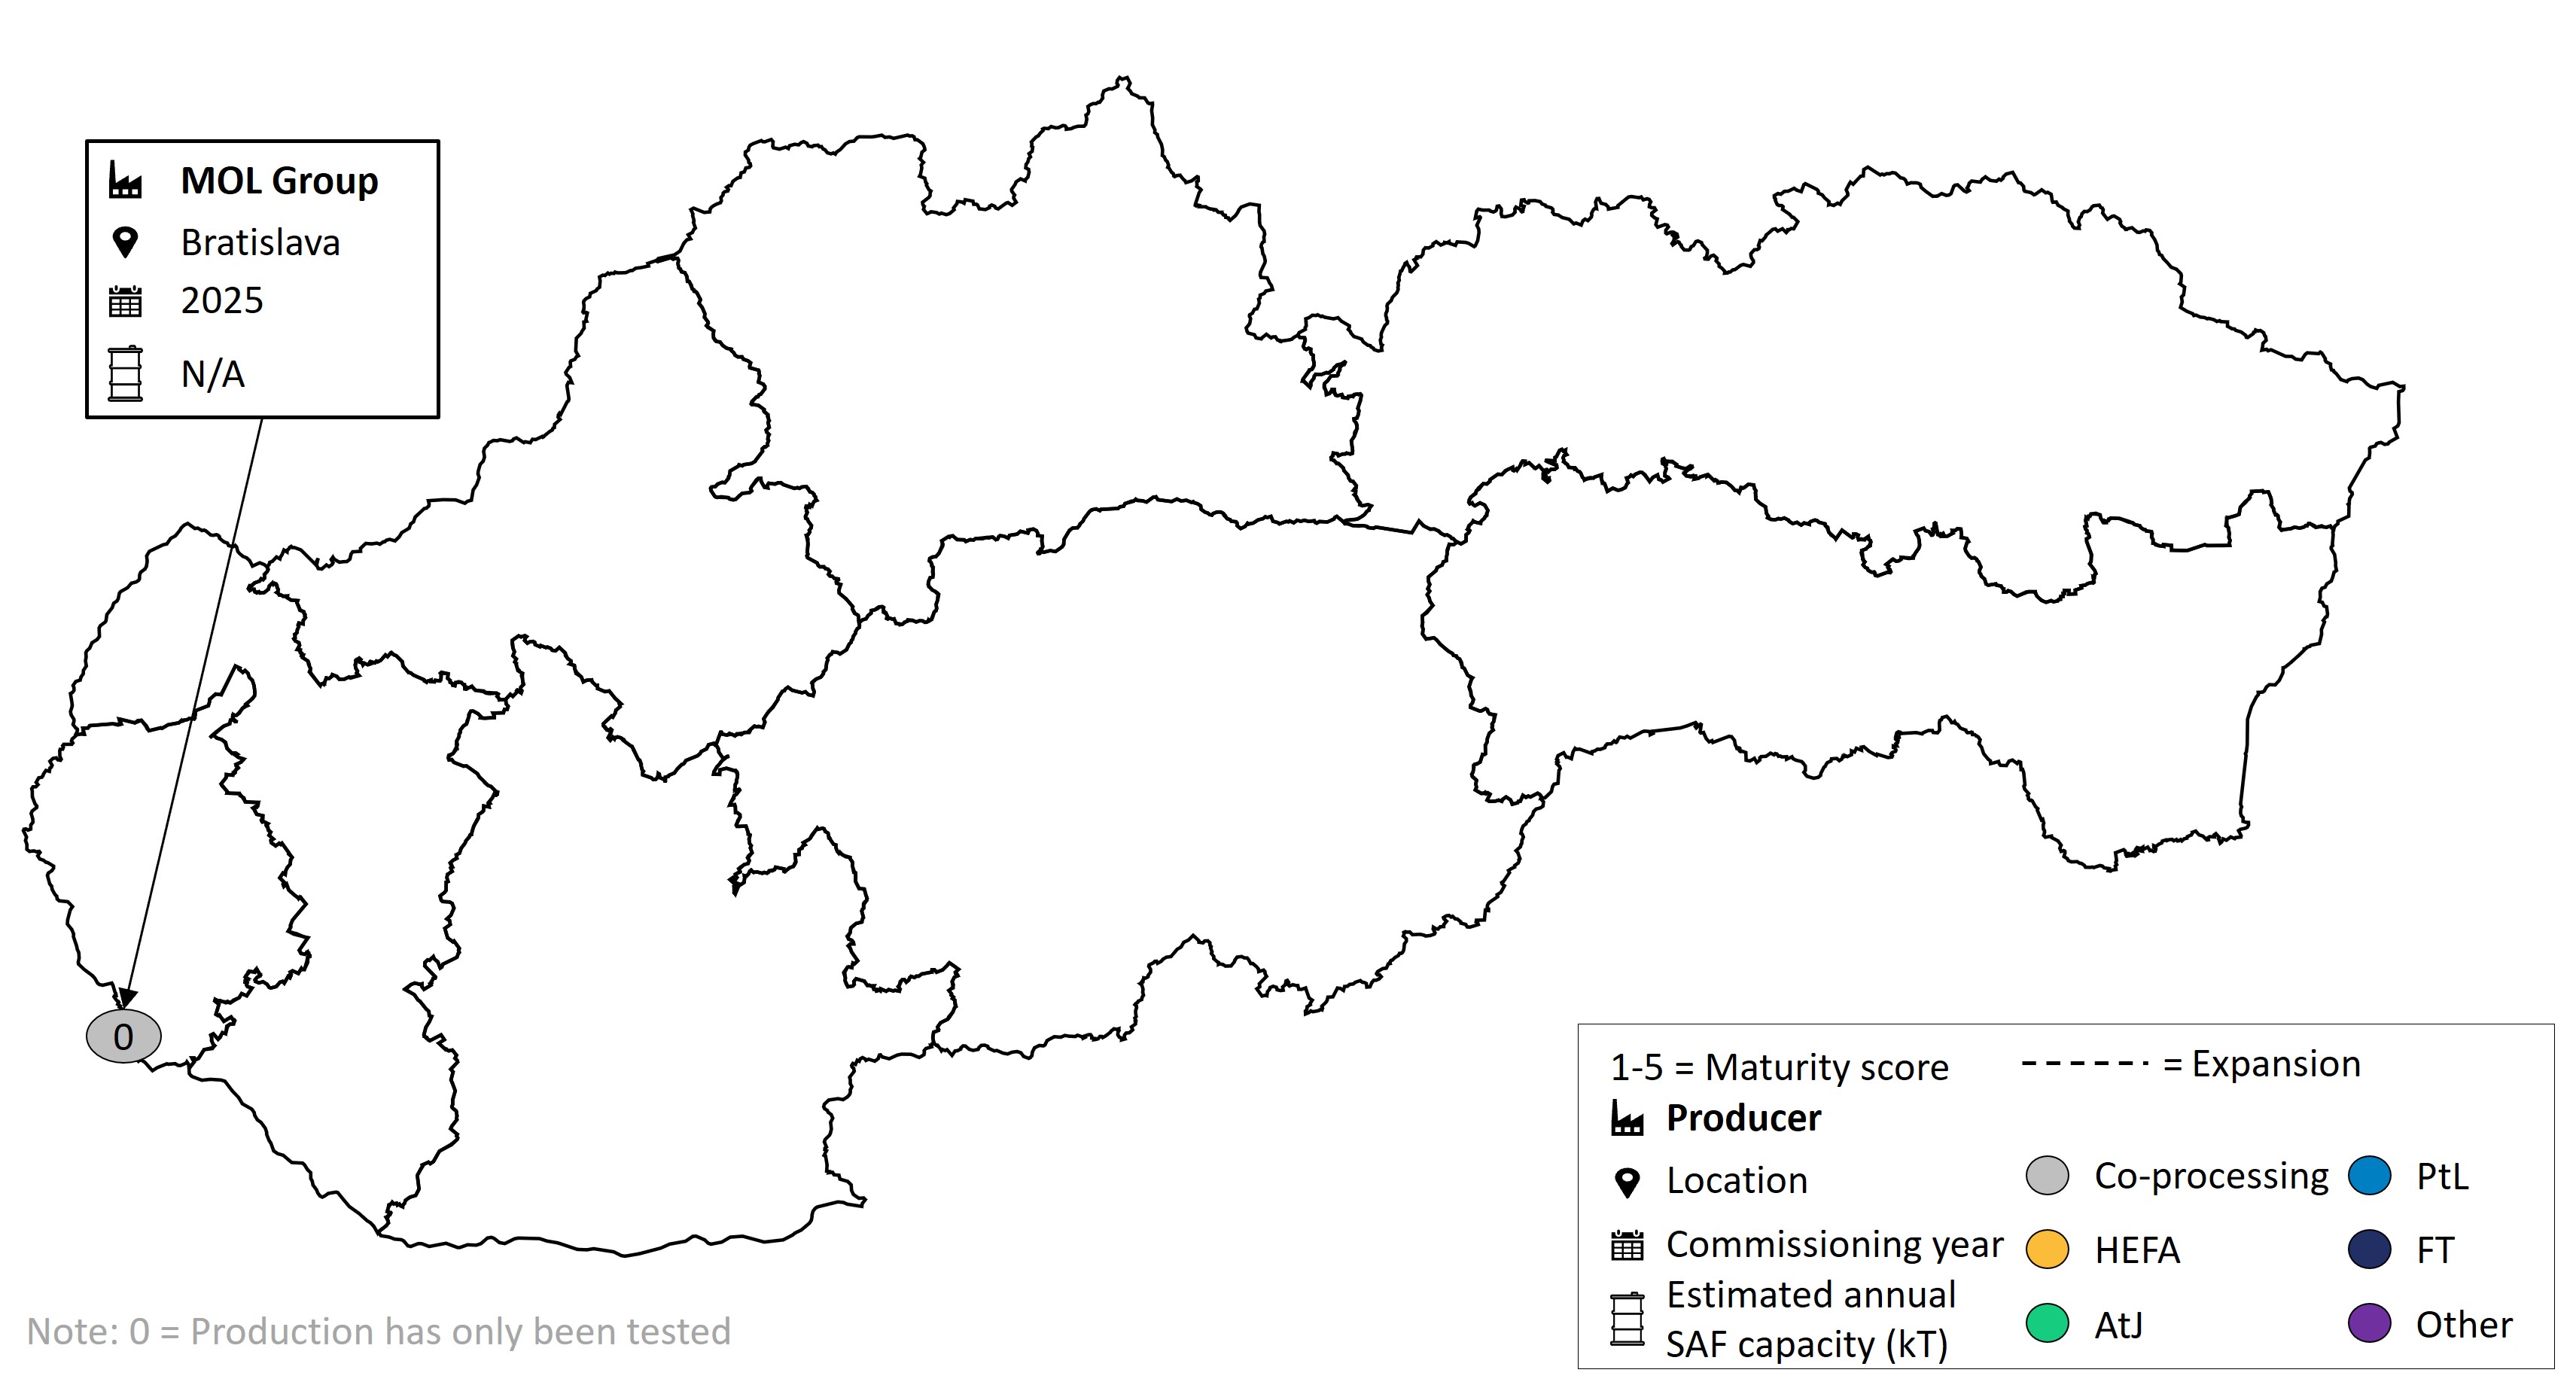
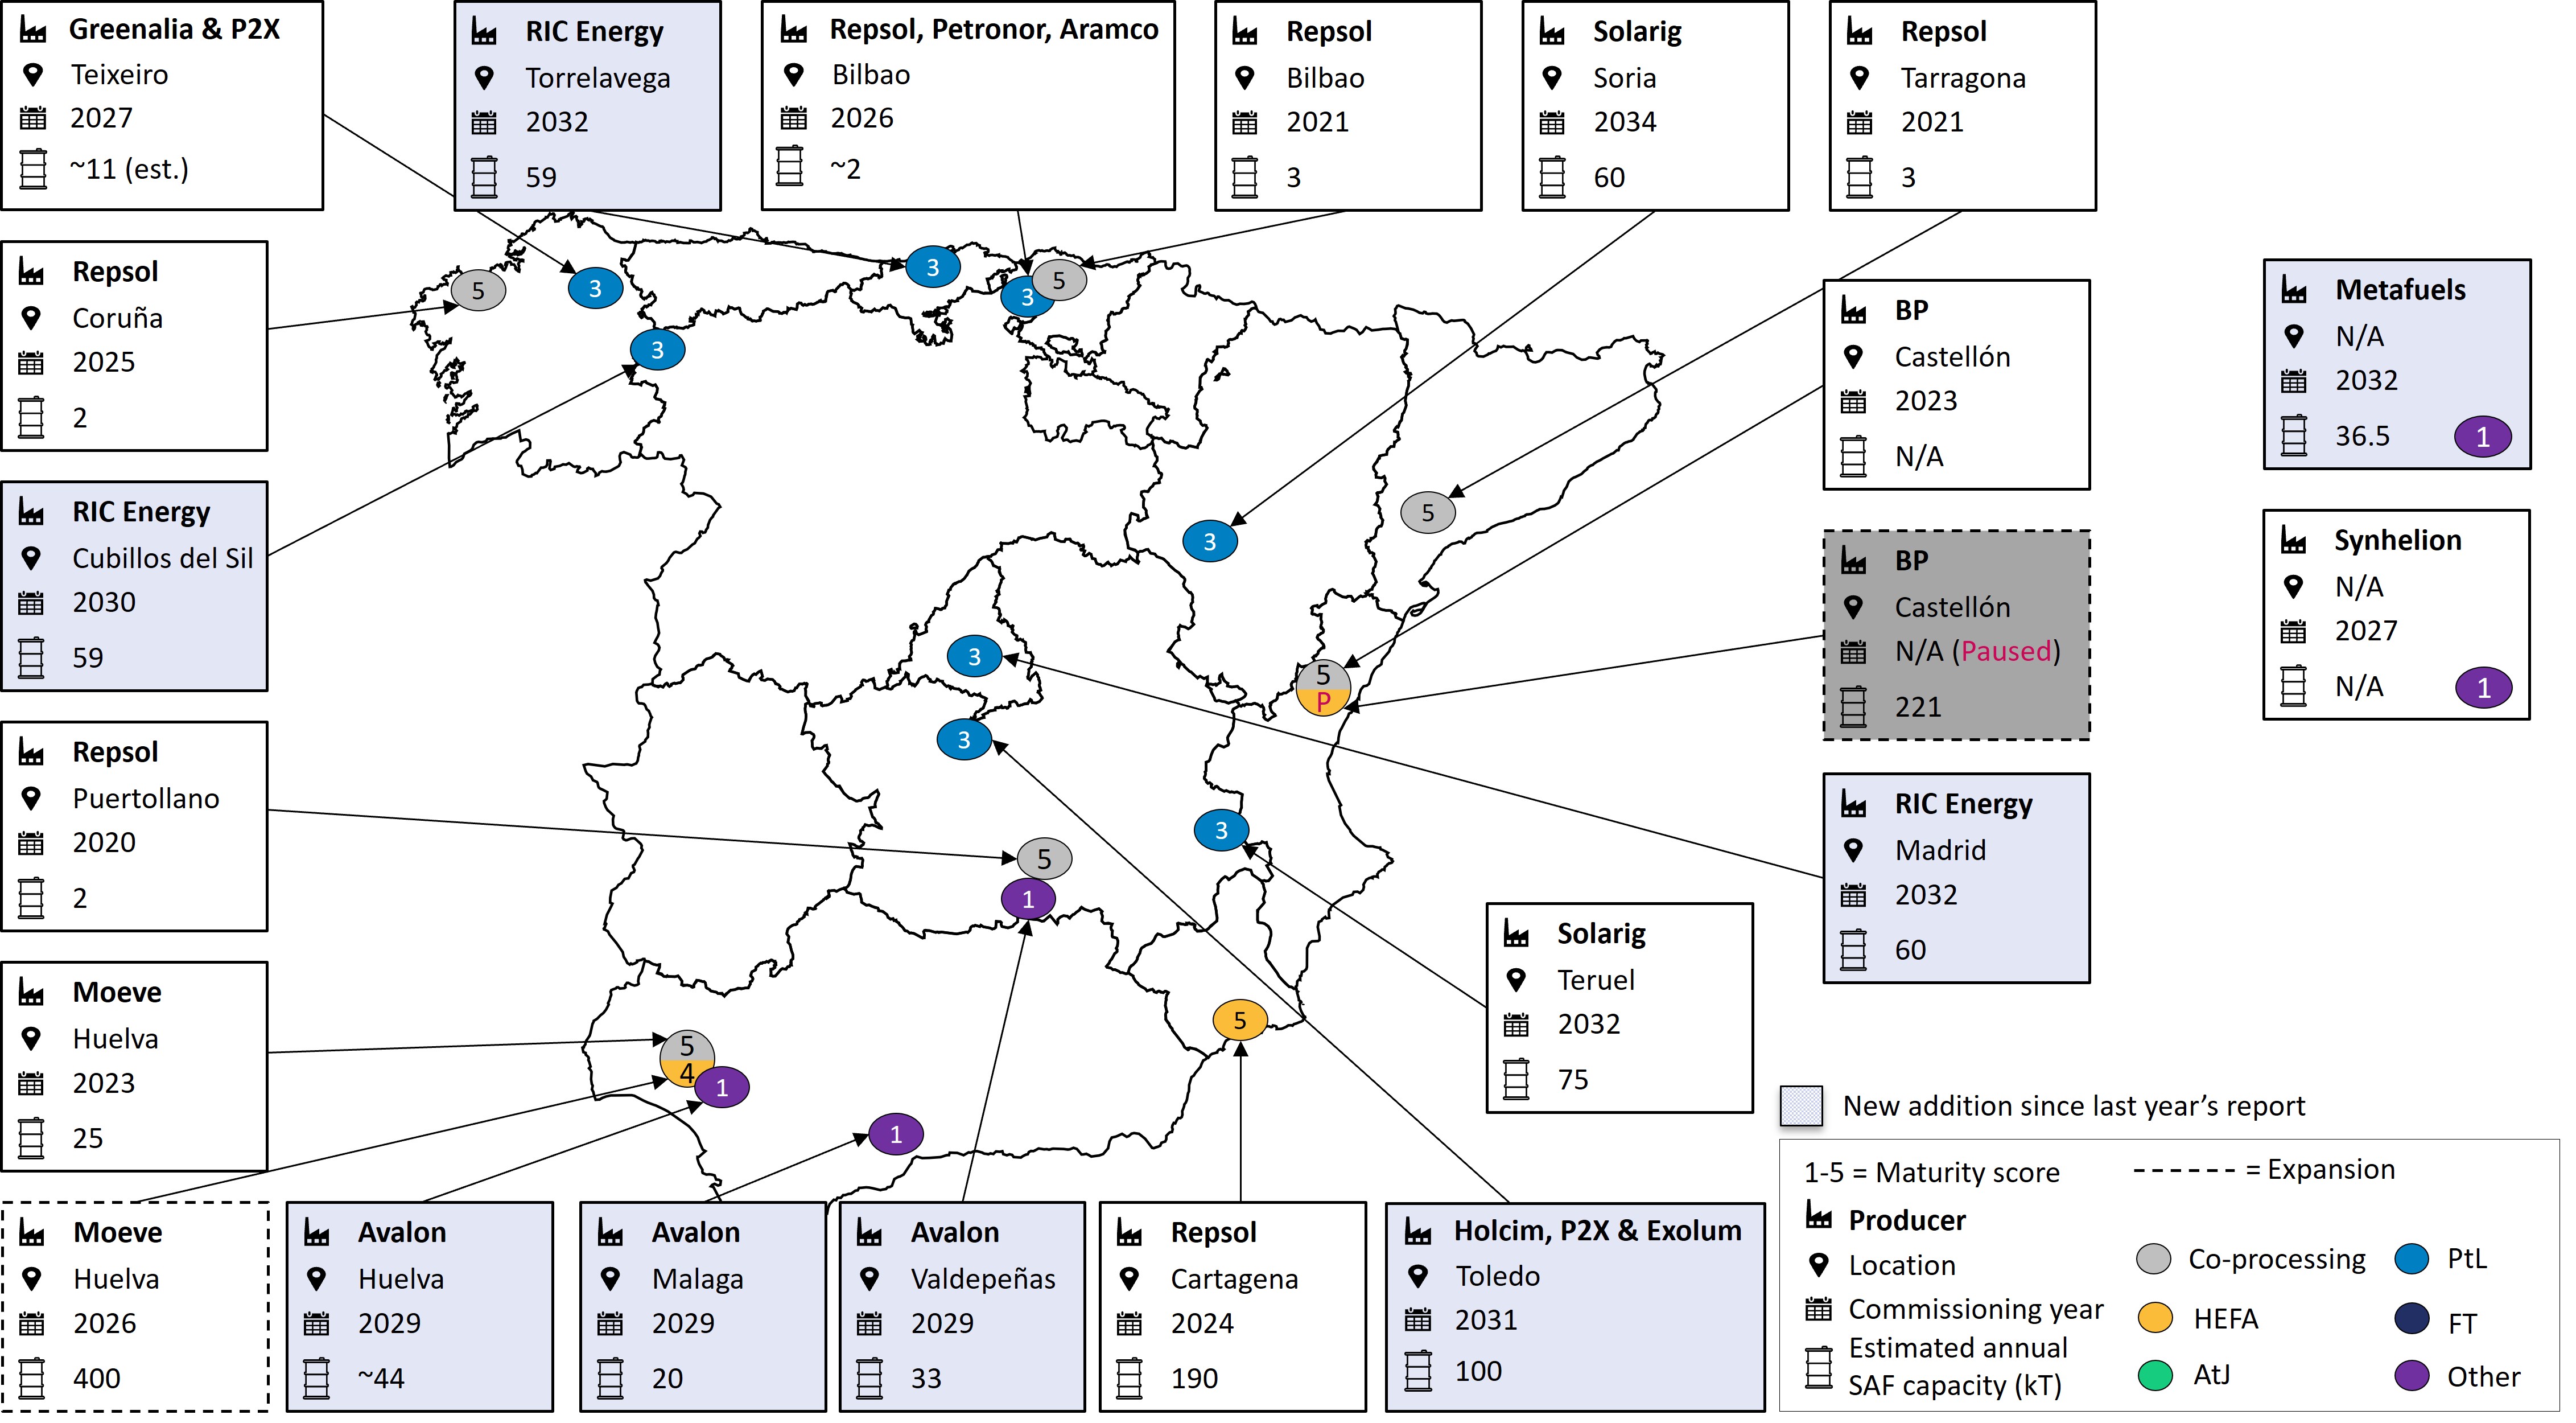
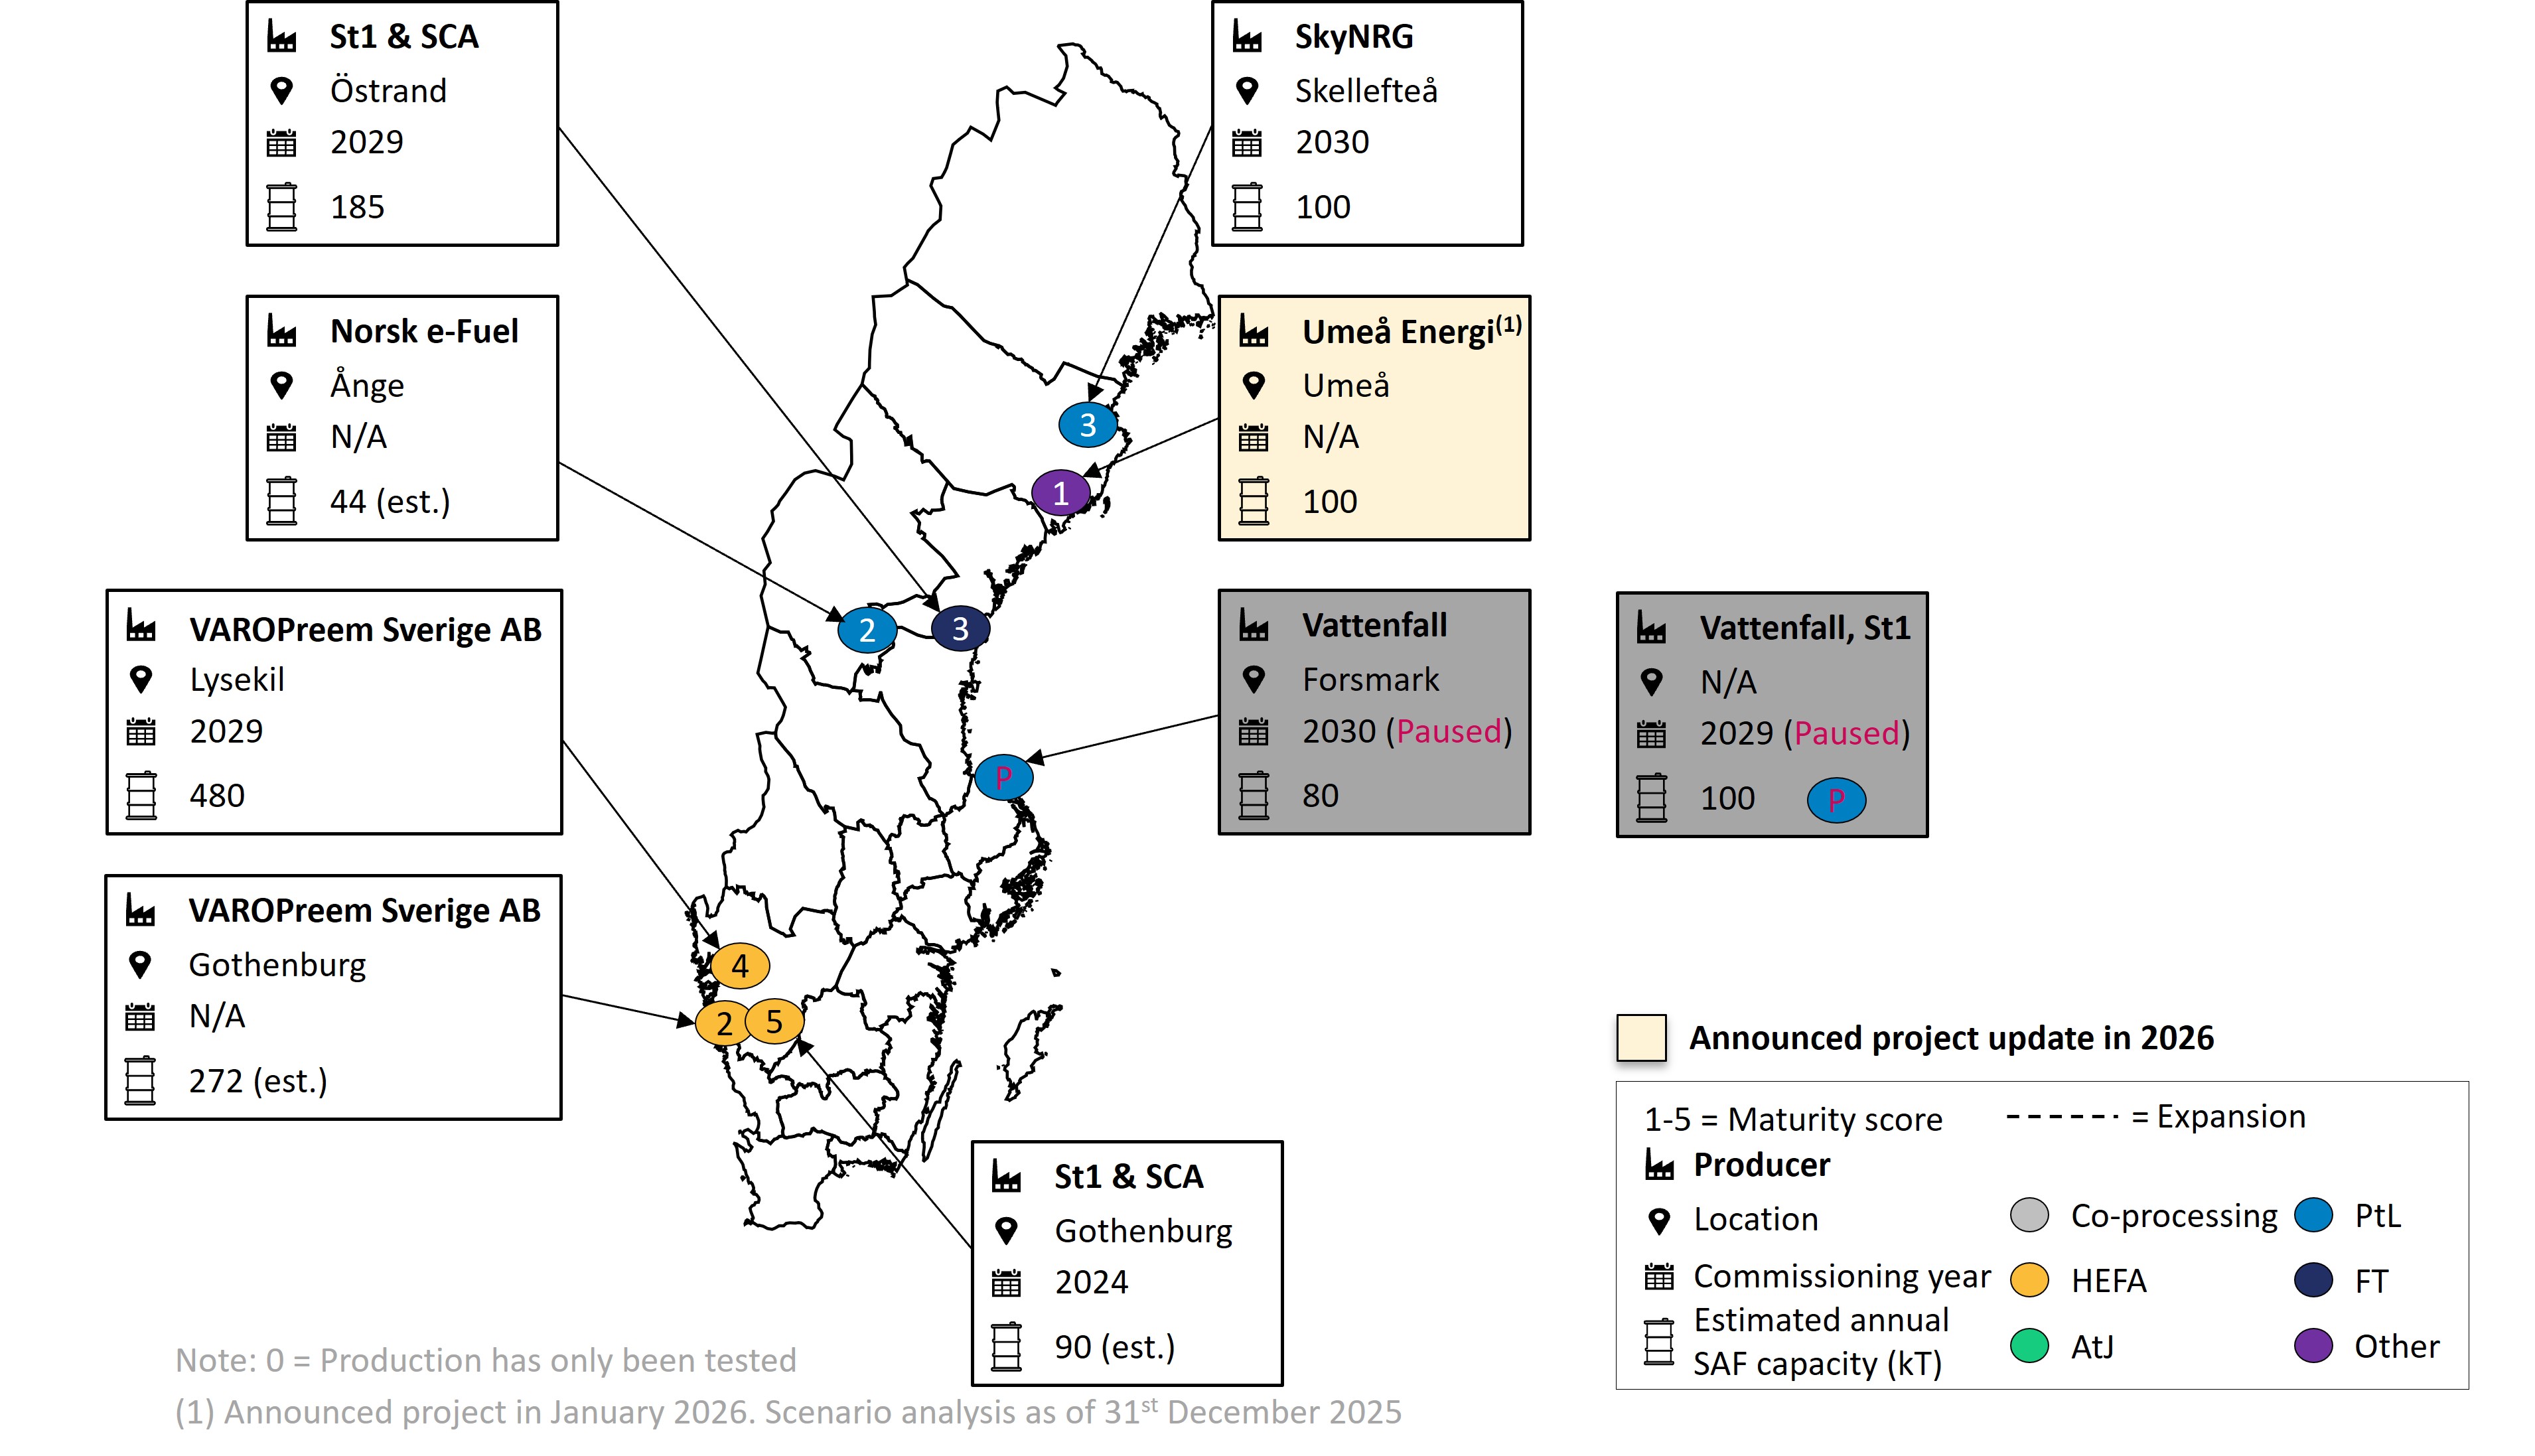
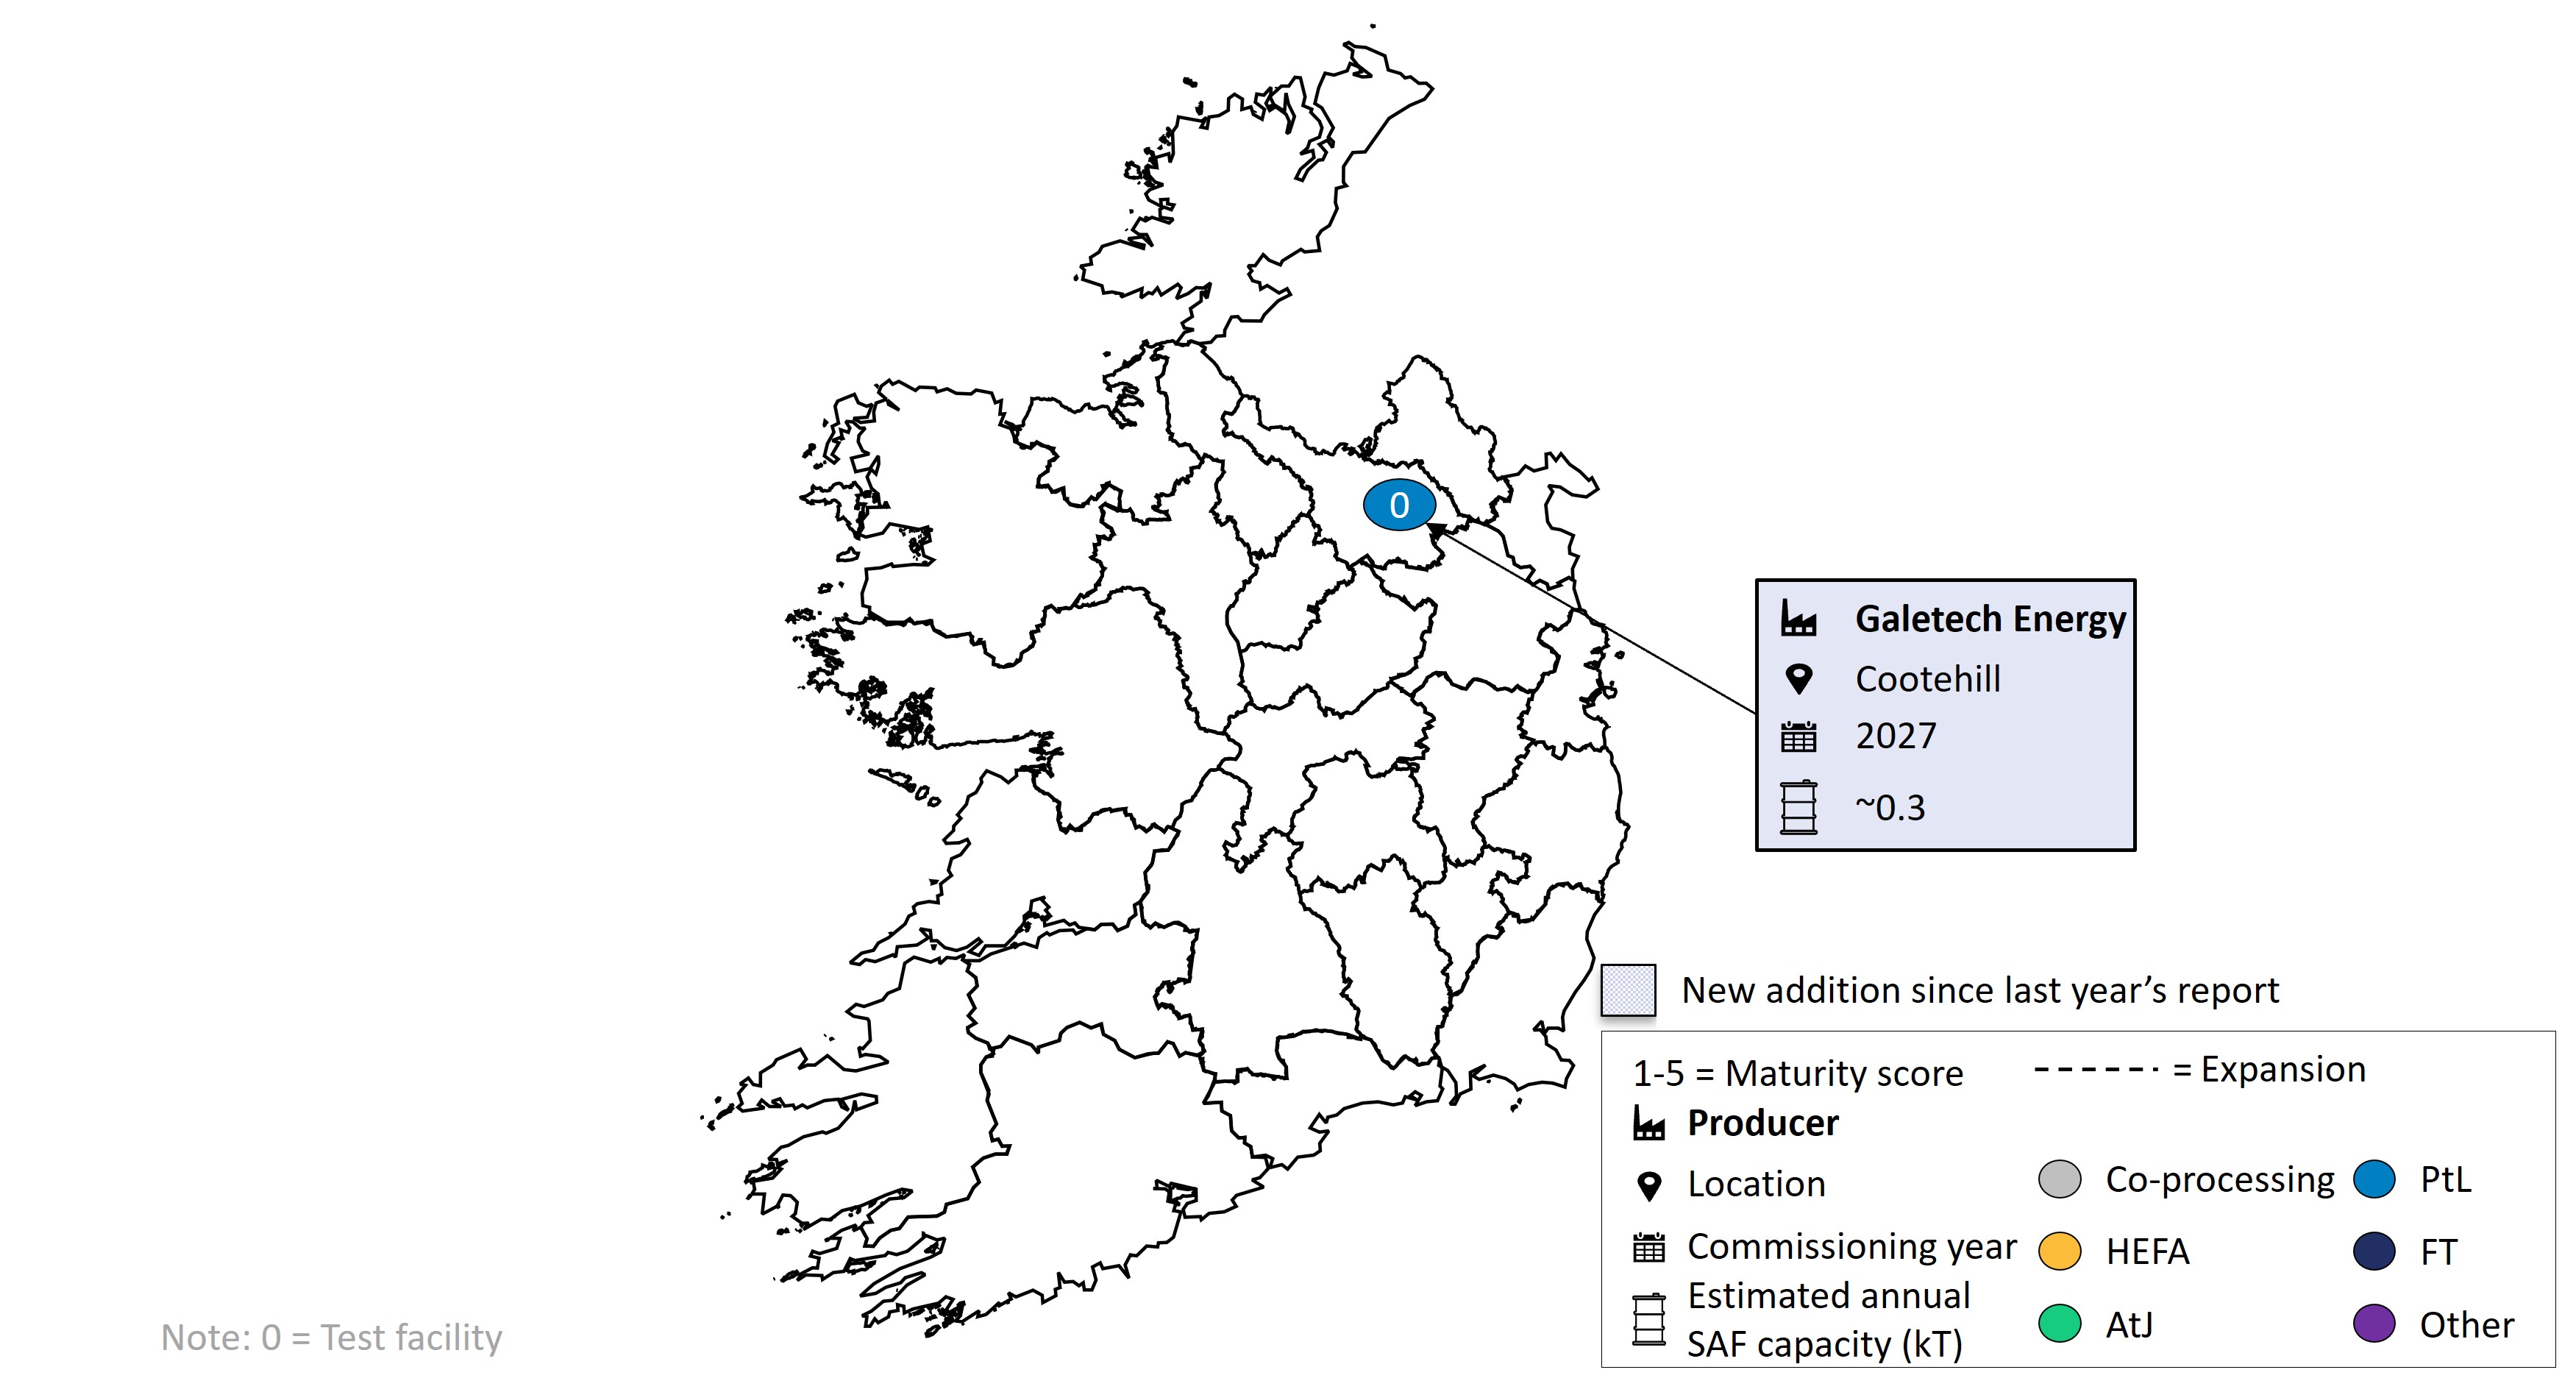
Additional Graphs

Reference prices for RFEUA aviation fuels
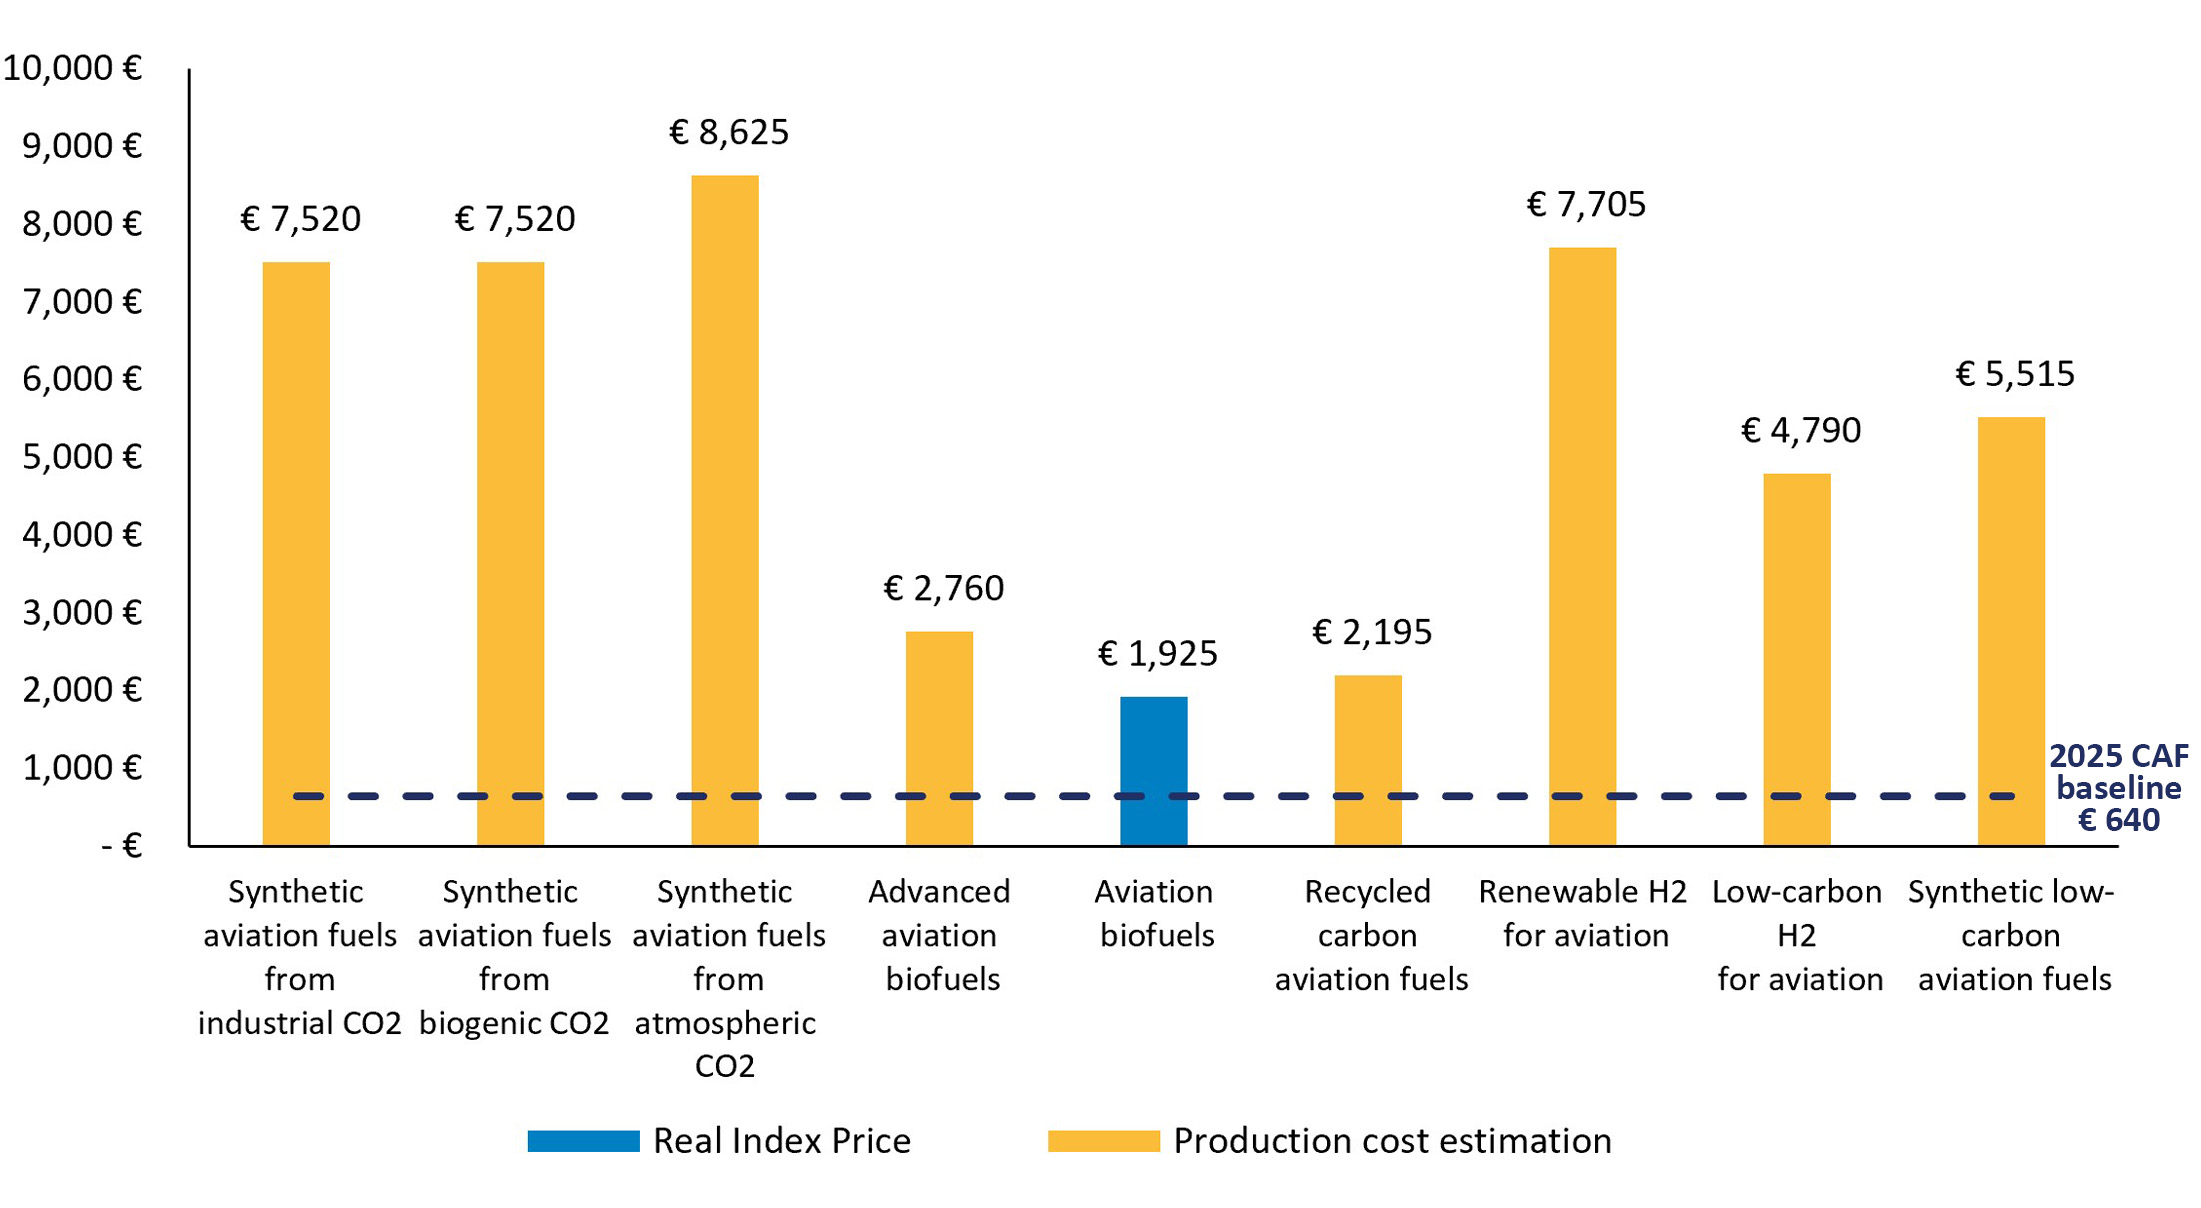
This graph is only available at Union level.
Percentage of Union Airport with an aggregated uplift higher than 90%

This graph is only available at Union level.
SAF by 2030 in the EU
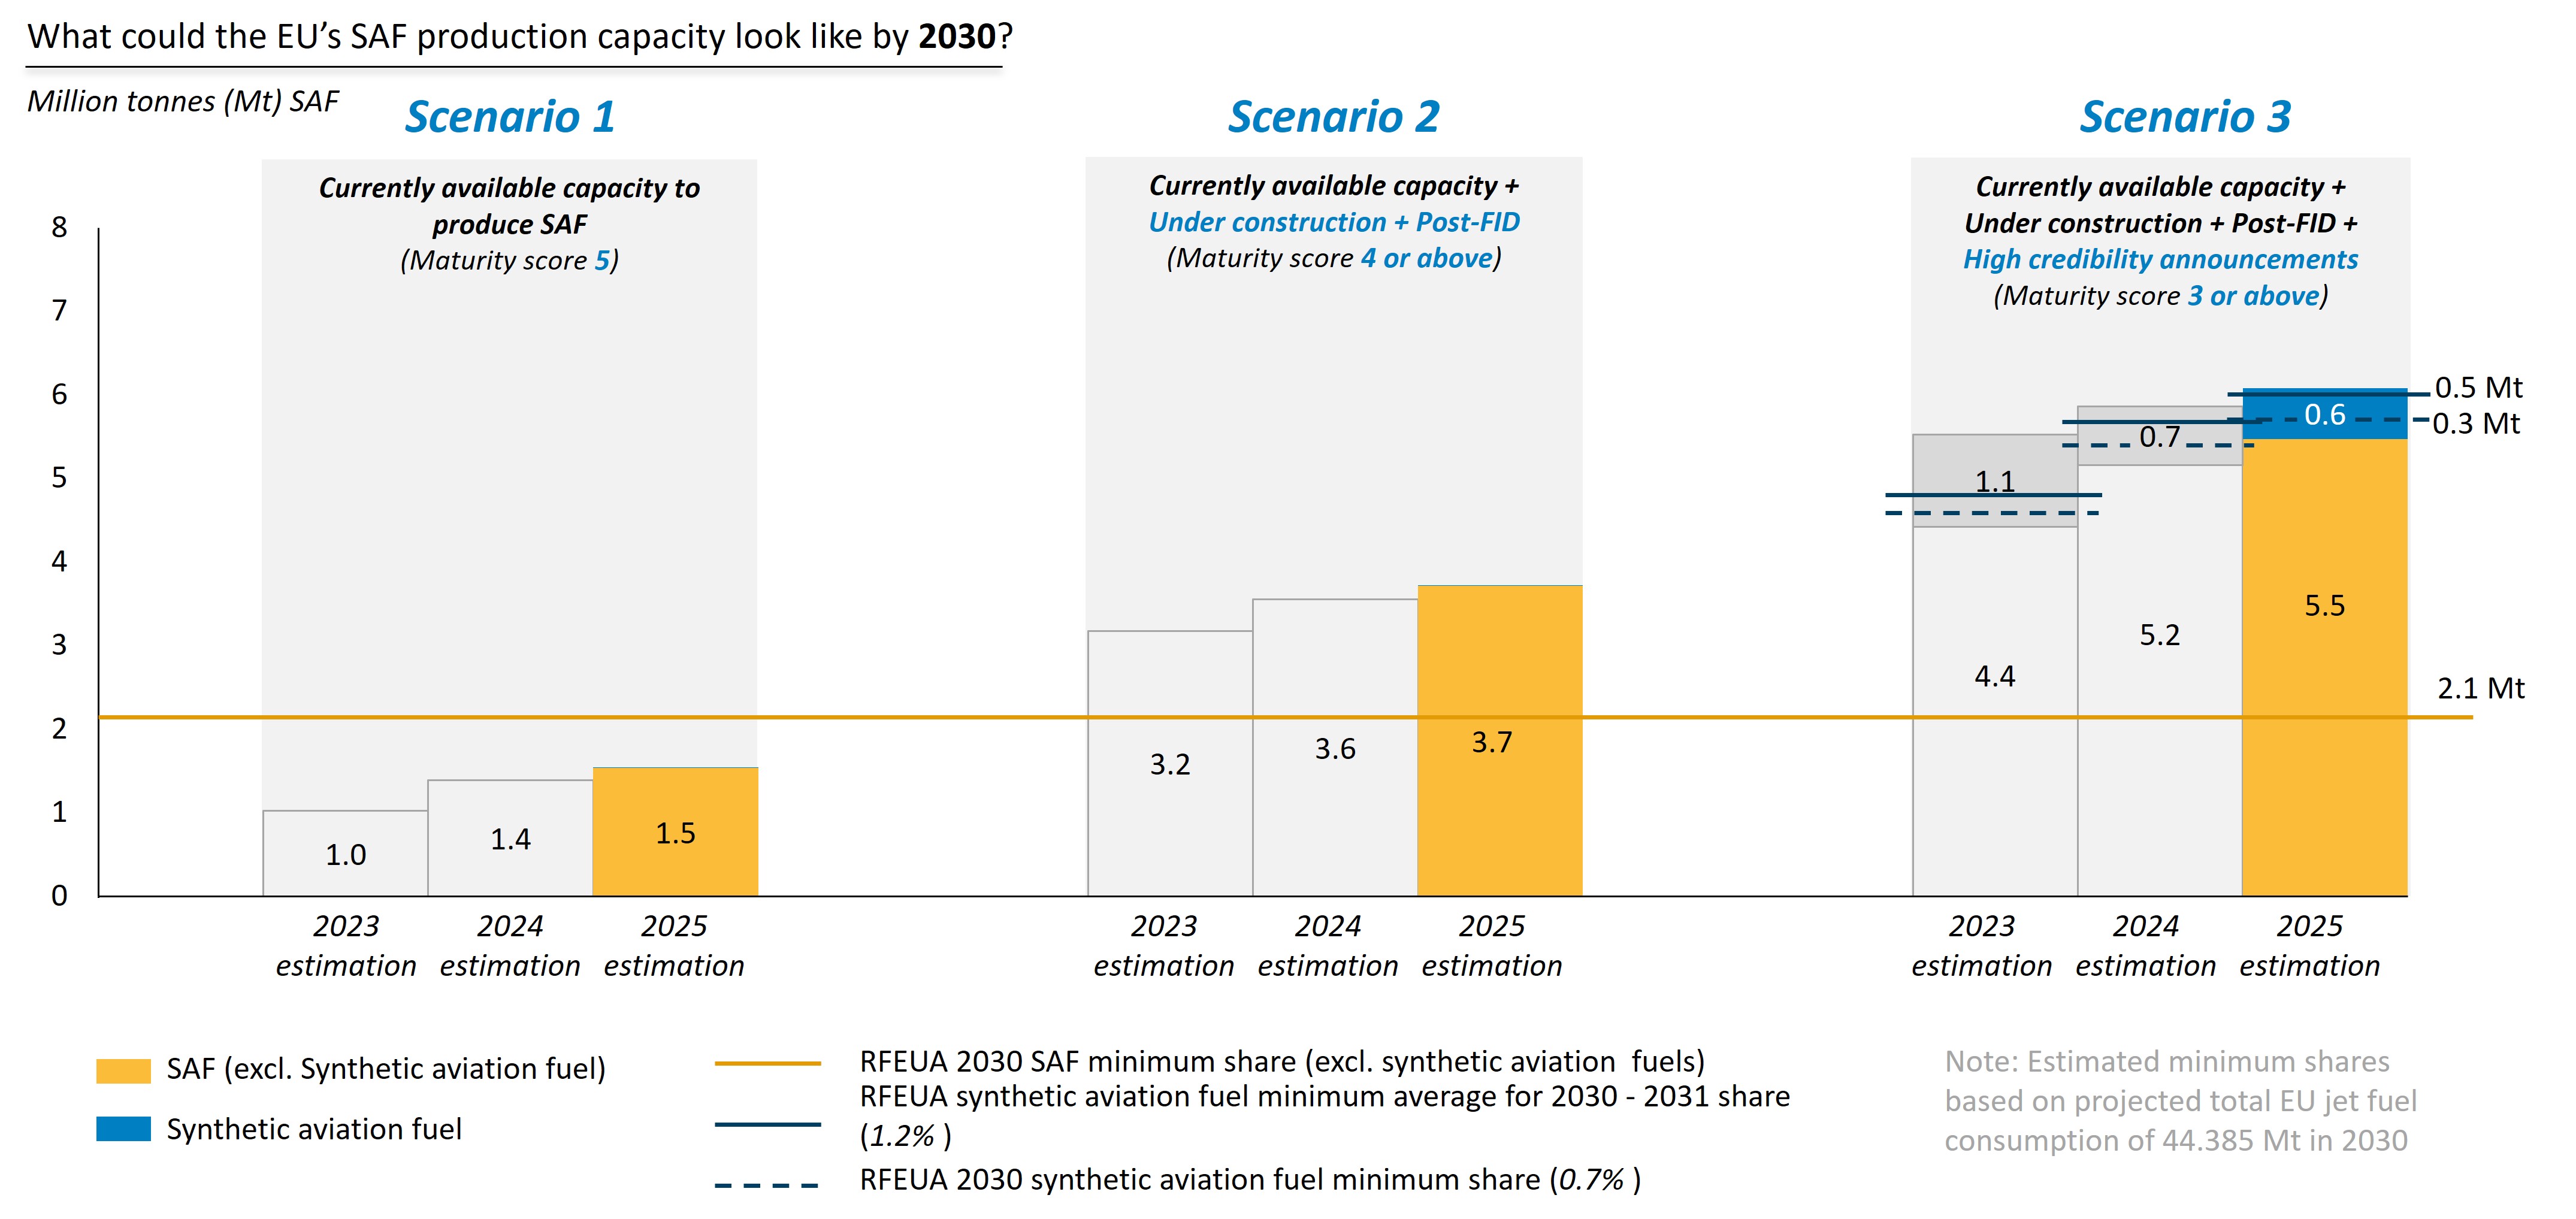
This graph is only available at Union level.
Included and excluded costs of PRA assessments

This graph is only available at Union level.