Future warming scenarios depend on choices made now and in the near term2
![Future warming scenarios depend on choices made now and in the near term [2]](/sites/default/files/styles/max_1300x1300/public/migrated_eaer_images/figure-2-1.png?itok=xj56w-an)
2 Observed (1900–2020) and projected (2021–2100) changes in global surface temperature (relative to 1850-1900), which are linked to changes in climate conditions and impacts, illustrate how the climate has already changed and will change along the lifespan of three representative generations (born in 1950, 1980 and 2020). Future projections (2021–2100) of changes in global surface temperature are shown for very low (SSP1-1.9), low (SSP1-2.6), intermediate (SSP2-4.5), high (SSP3-7.0) and very high (SSP5-8.5) GHG emissions scenarios. Changes in annual global surface temperatures are presented as ‘climate stripes’, with future projections showing the human-caused long-term trends and continuing modulation by natural variability (represented here using observed levels of past natural variability). Colours on the generational icons correspond to the global surface temperature stripes for each year, with segments on future icons differentiating possible future experiences.
Ranking of annual average sea surface temperature in 2023
![Ranking of annual average sea surface temperature in 2023 [4]](/sites/default/files/styles/max_1300x1300/public/migrated_eaer_images/figure-2-2.png?itok=Joub9GY2)
Ranking of annual average surface air temperature in 2023
![Ranking of annual average surface air temperature in 2023 [4]](/sites/default/files/styles/max_1300x1300/public/migrated_eaer_images/figure-2-3.png?itok=zH4UUxwe)
Latest best estimates for climate forcing terms of historic global aviation emissions from 1940 to 2018
![Latest best estimates for climate forcing terms of historic global aviation emissions from 1940 to 2018 [9]](/sites/default/files/styles/max_1300x1300/public/migrated_eaer_images/figure-2-4.png?itok=2HcMI42X)
Effect on CO2 and non-CO2 Effective Radiative Forcing (ERF) during the COVID pandemic
![Effect on CO<sub>2</sub> and non-CO<sub>2</sub> Effective Radiative Forcing (ERF) during the COVID pandemic [extended analysis based on 9]](/sites/default/files/styles/max_1300x1300/public/migrated_eaer_images/figure-2-5.png?itok=xO8o_ckr)
Formation of contrails and timescales
![Formation of contrails and timescales [10]](/sites/default/files/styles/max_1300x1300/public/migrated_eaer_images/figure-2-6.png?itok=KWII8gJS)
Average concentration of UFP at and in the area around Paris Charles de Gaulle airport between September and December 2022 (number of UFP/cm3)
![Average concentration of UFP at and in the area around Paris Charles de Gaulle airport between September and December 2022 (number of UFP/cm<sup>3</sup>) [60]](/sites/default/files/styles/max_1300x1300/public/migrated_eaer_images/figure-2-8.png?itok=EDOcqlQu)
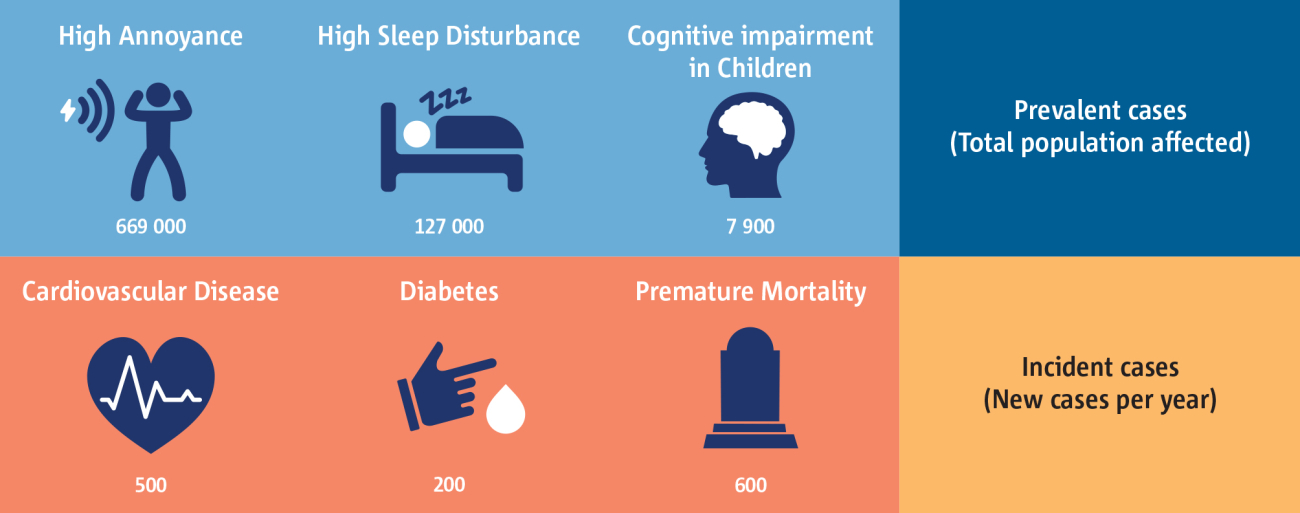
Population exposure to aircraft noise based on END and WHO noise thresholds at 50 airports in the EU plus Iceland, Norway and Switzerland
![Population exposure to aircraft noise based on END and WHO noise thresholds at 50 airports in the EU plus Iceland, Norway and Switzerland [85]](/sites/default/files/styles/max_1300x1300/public/migrated_eaer_images/figure-2-9.png?itok=XCCLCPiW)