Figure 1.1
Low-cost recovered faster from COVID than mainline carriers
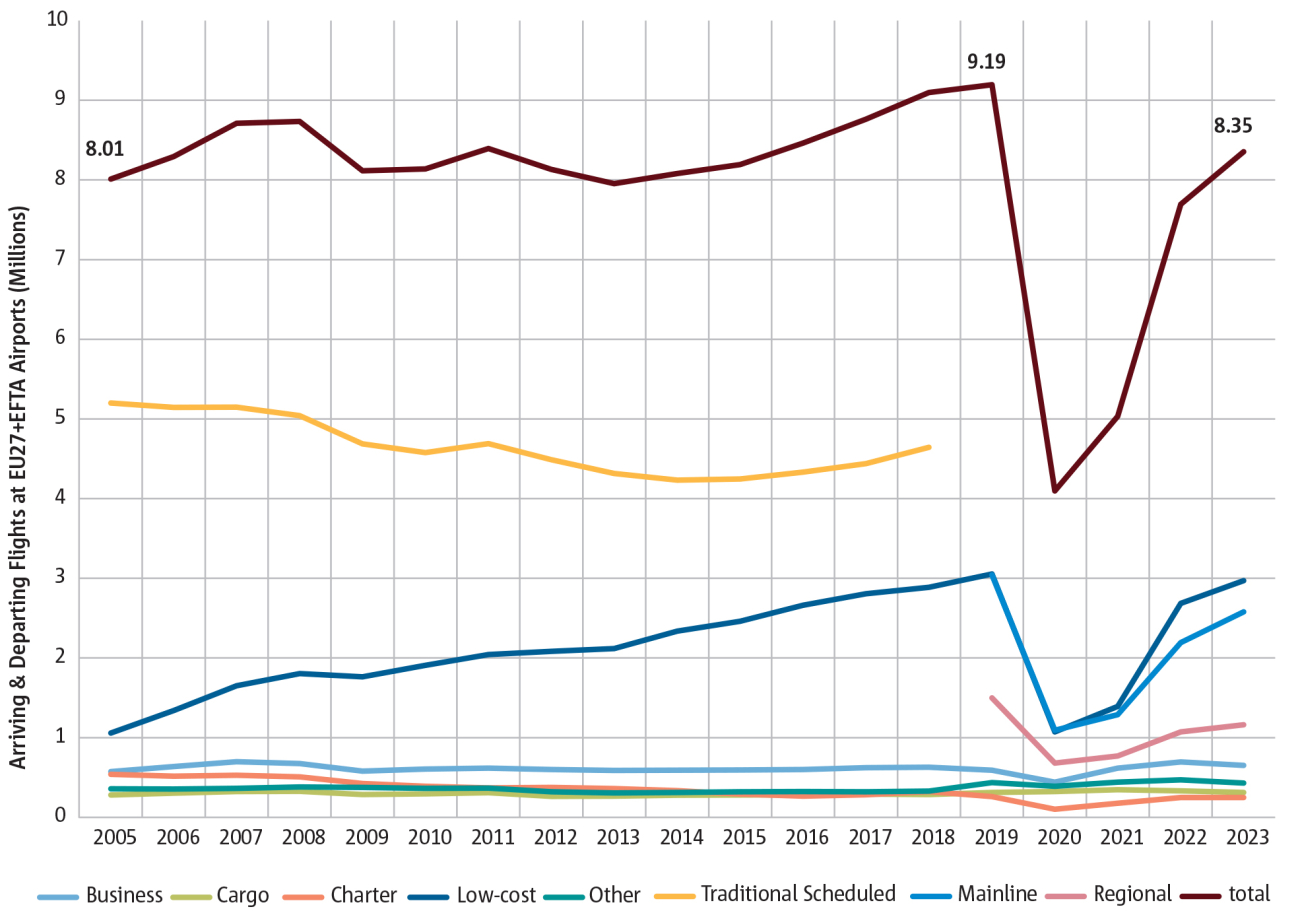
Note: From 2019 onwards the ‘traditional scheduled’ carrier category has been split into two categories, ‘mainline’ and ‘regional’. See Appendix C for more information about market segments.
Figure 1.2
Annual flights could exceed 10 million shortly after 2030
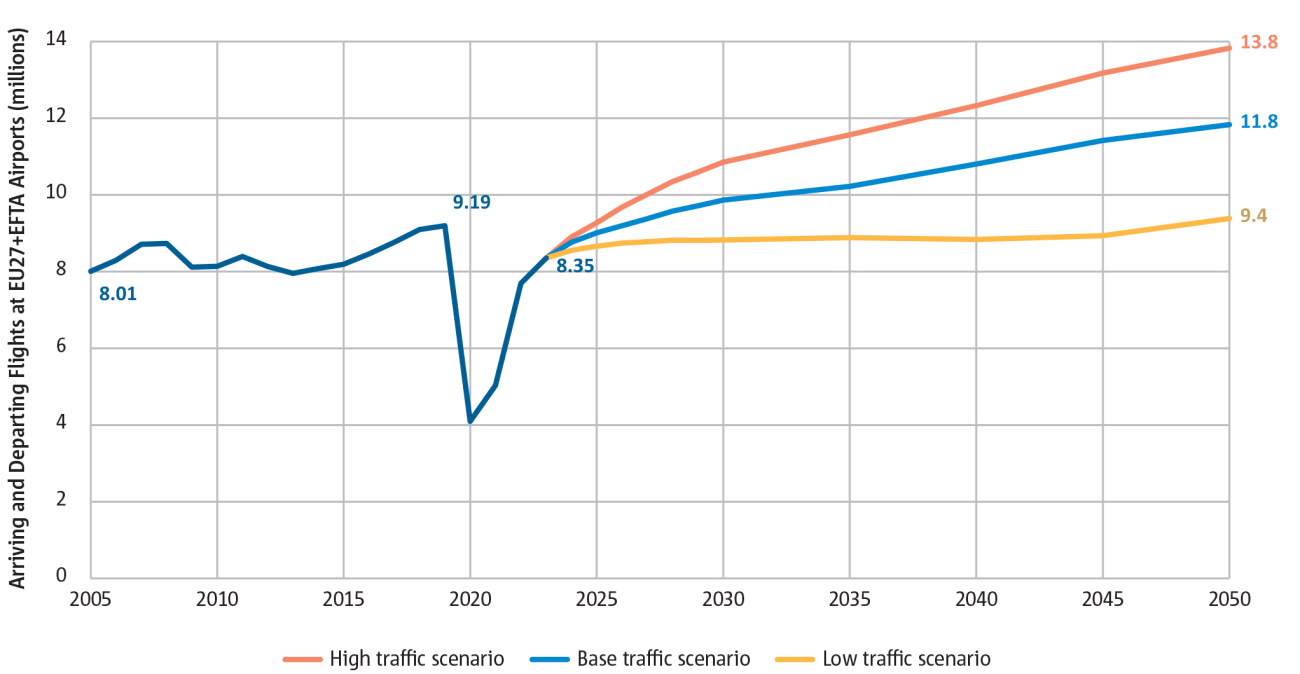
Figure 1.3
Very short-haul flights show the slowest recovery after COVID crisis
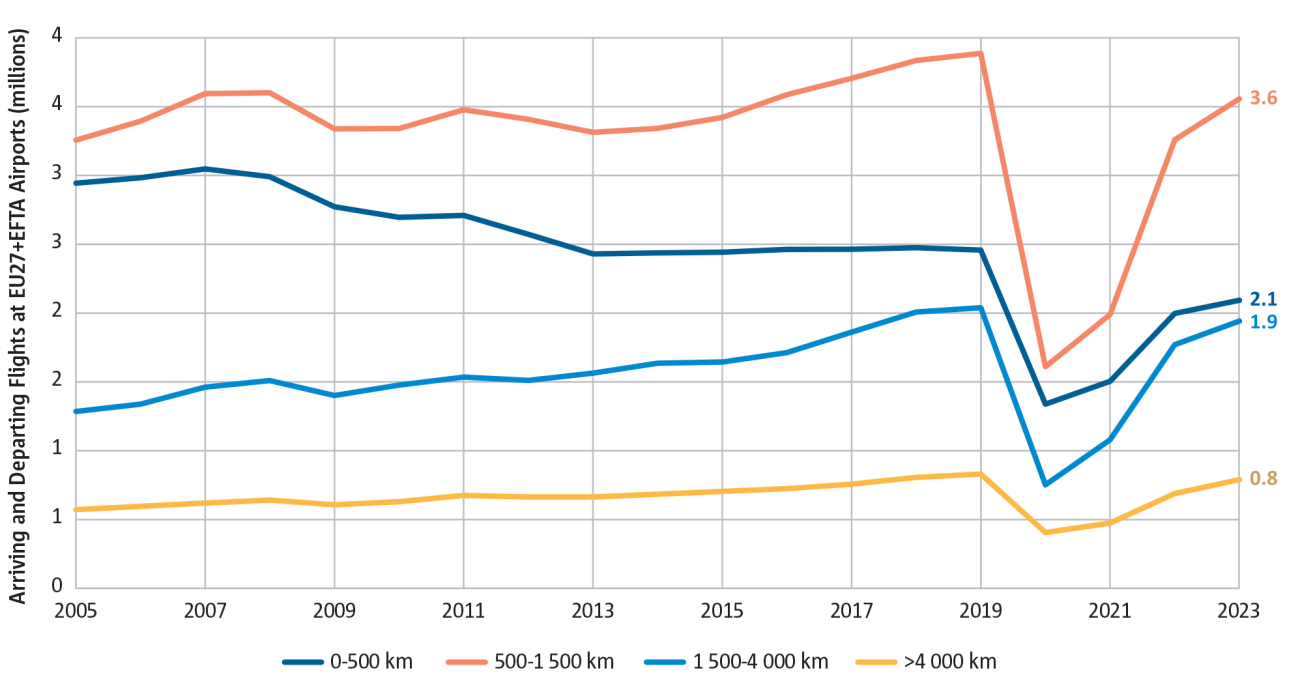
Figure 1.4
Extra-European connectivity recovering slower than intra-European after COVID
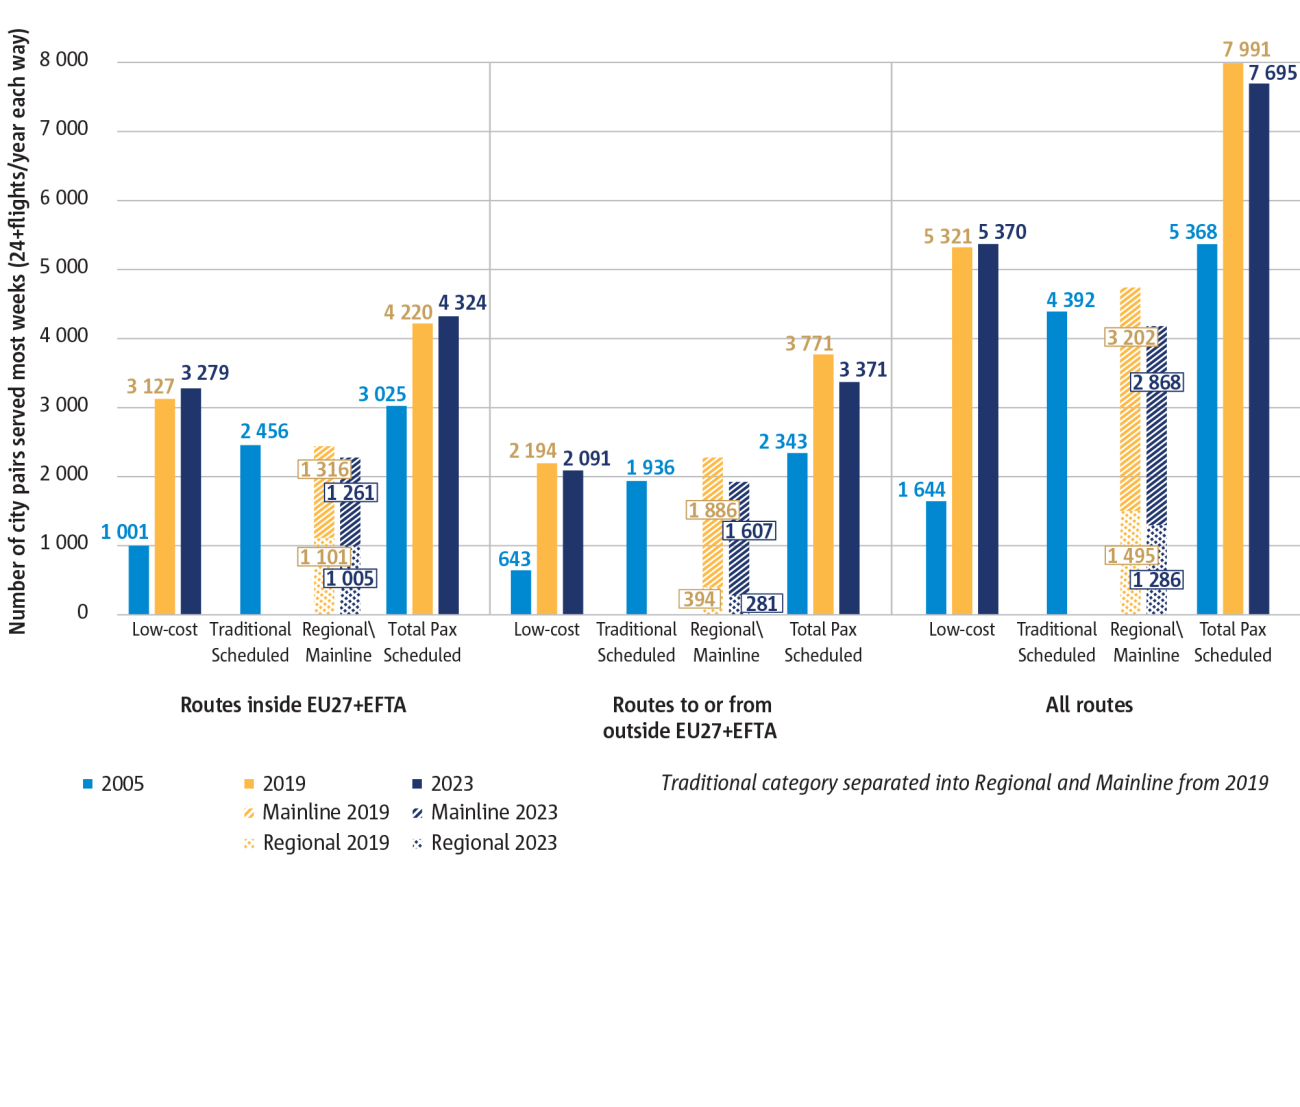
Figure 1.5
Fleet continues to age slowly for most carrier categories

Figure 1.6(a)
The number of night flights is still below 2019 level but their share of total flights is higher
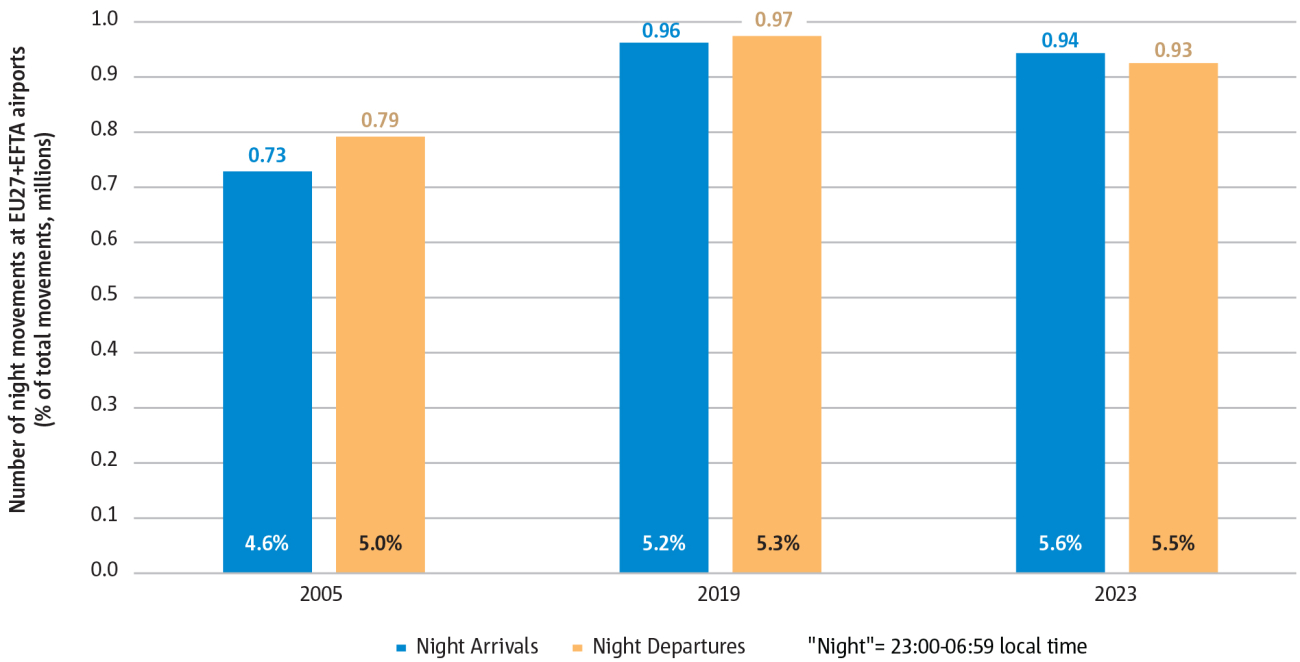
Figure 1.6(b)
Airport traffic peaks just before and after the night period
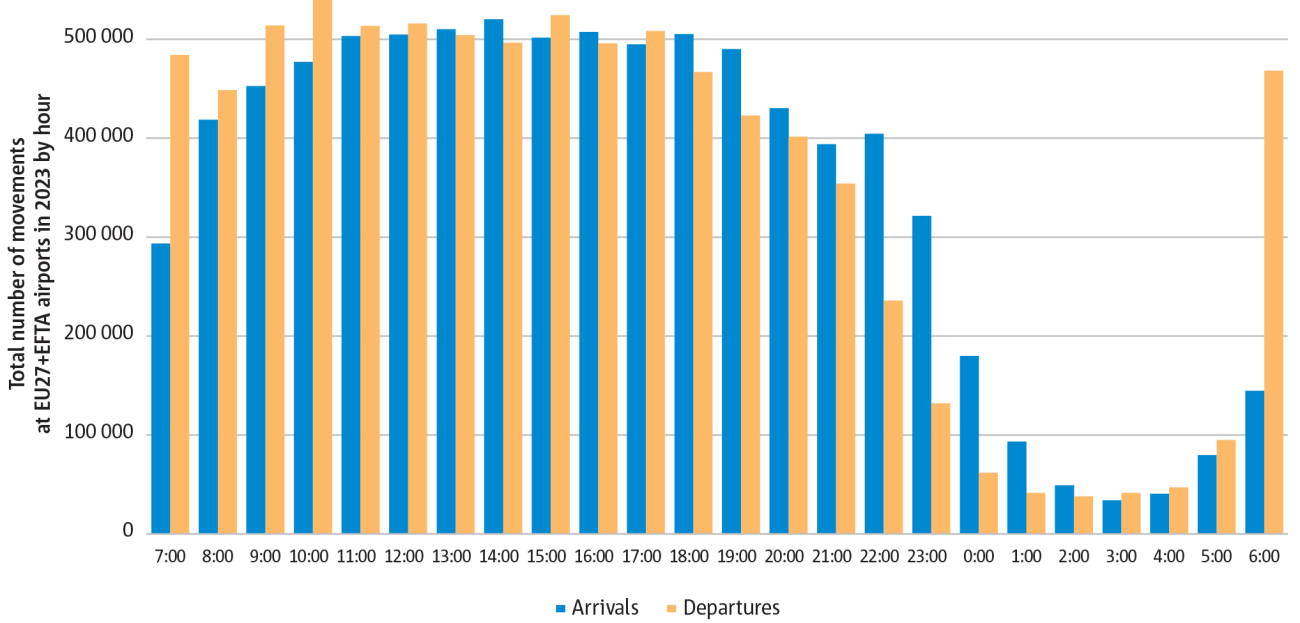
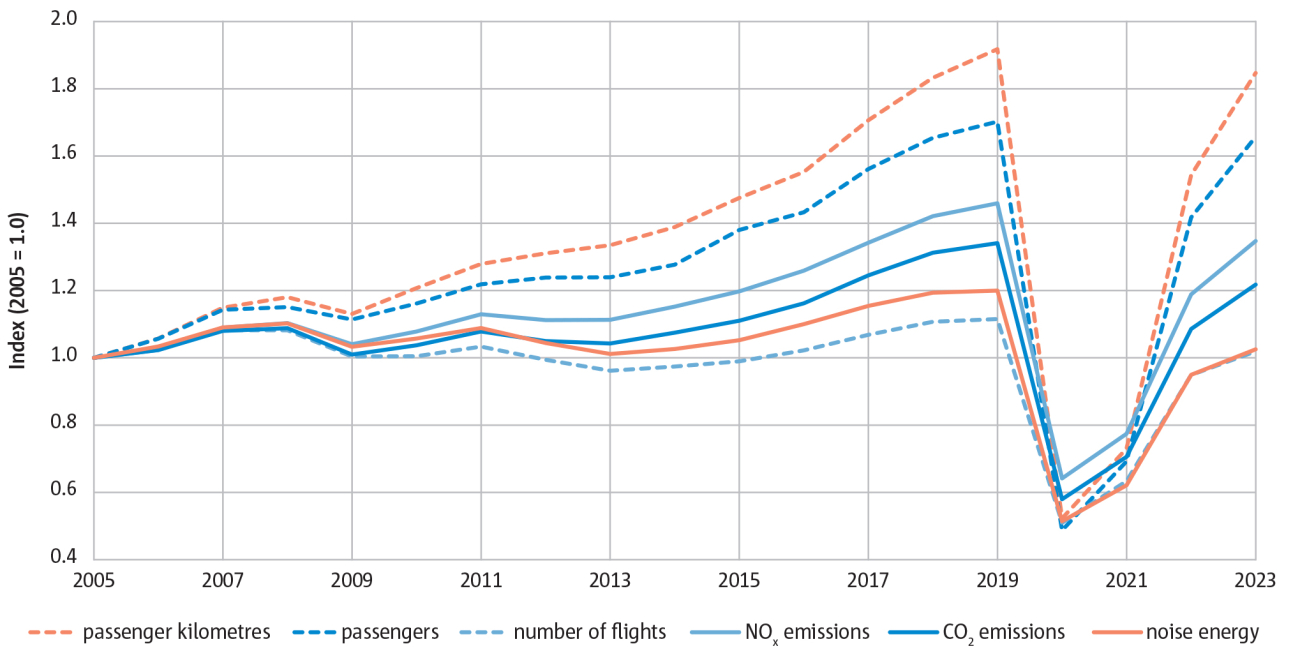
Figure 1.7
Summary of air traffic indicators (% change to 2005)
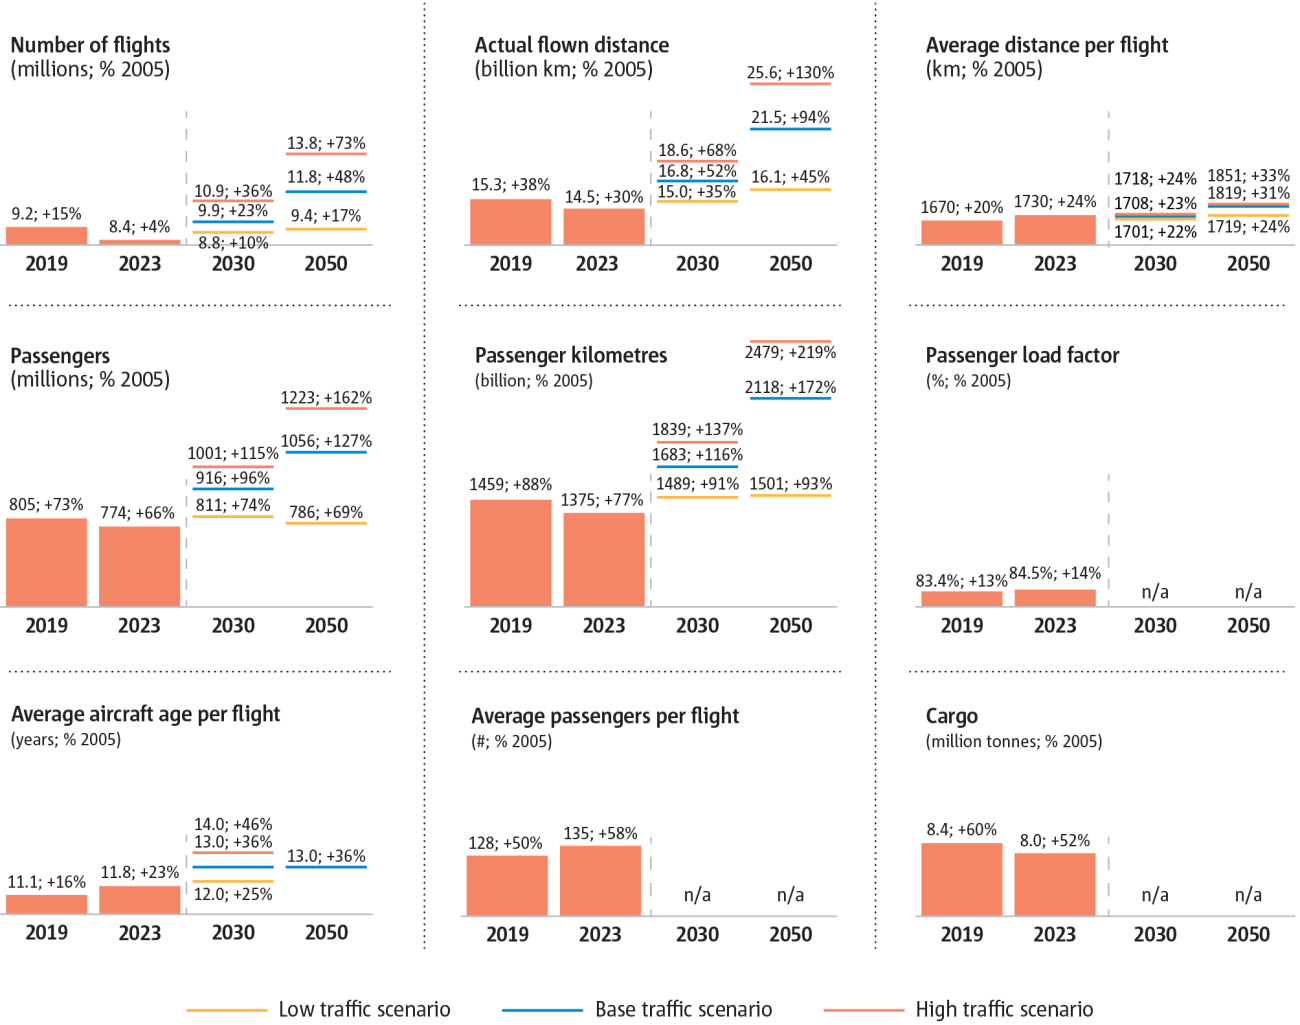
Figure 1.8
Total Lden dB population around major airports may stay below pre-COVID level
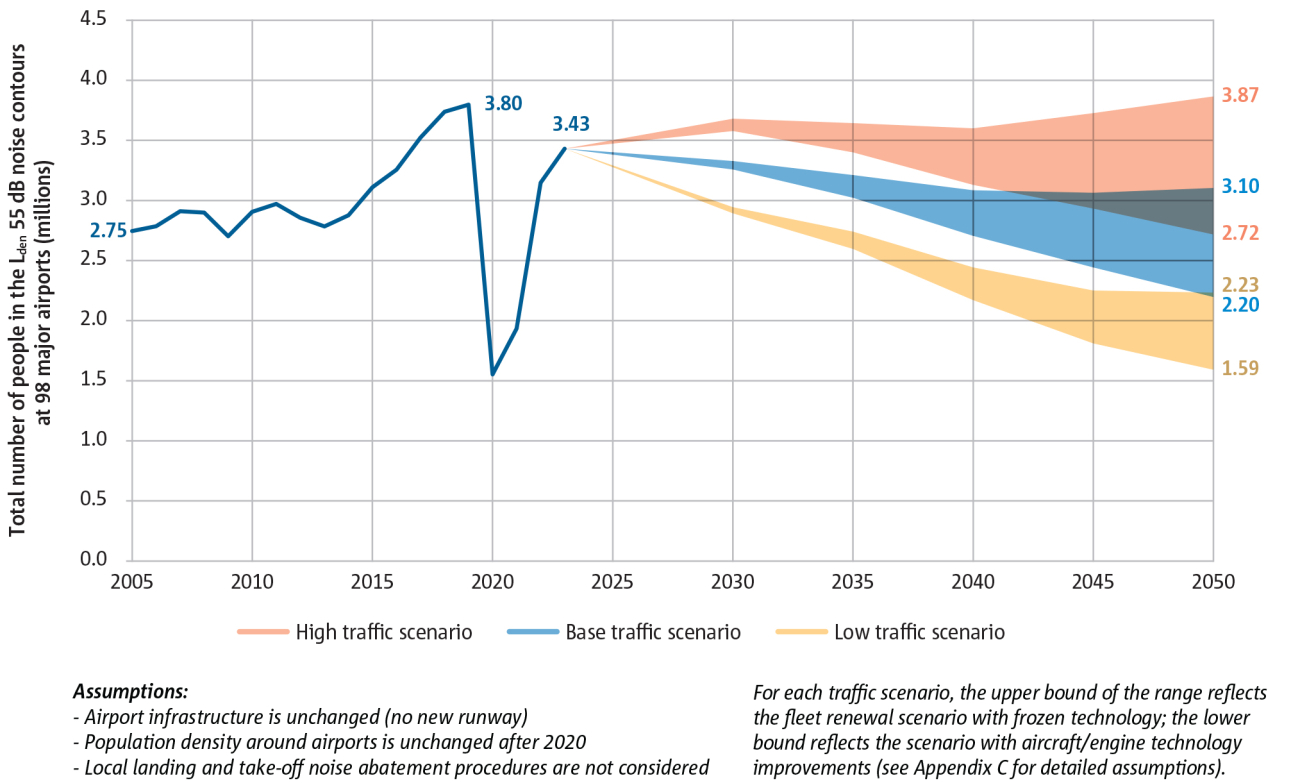
Figure 1.9
Summary of noise indicators (% change to 2005)
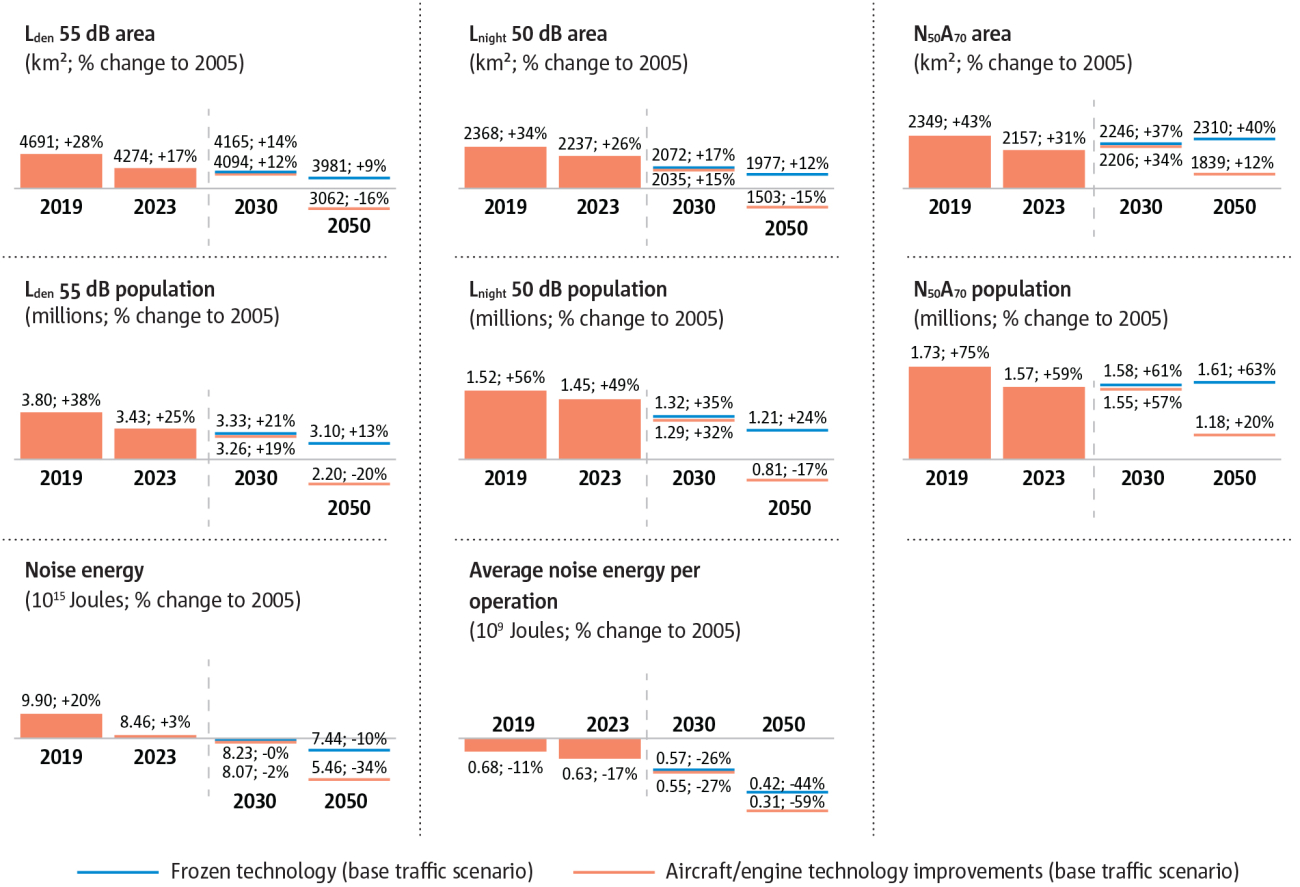
Figure 1.10(a)
Aircraft technology and ATM improvements could prevent further growth in European aviation’s CO2 emissions over the next decades
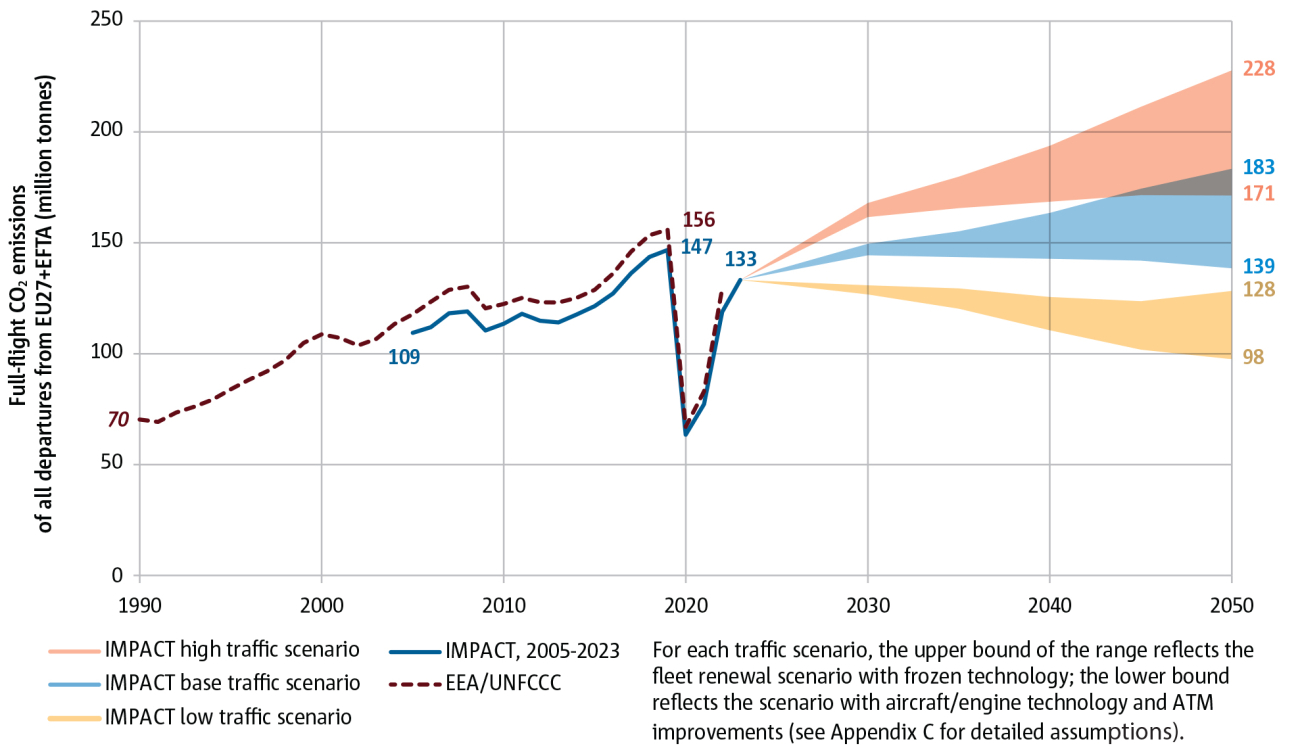
Figure 1.10(b)
Meeting the SAF supply mandate would cut net CO2 emissions by at least 47% in 2050
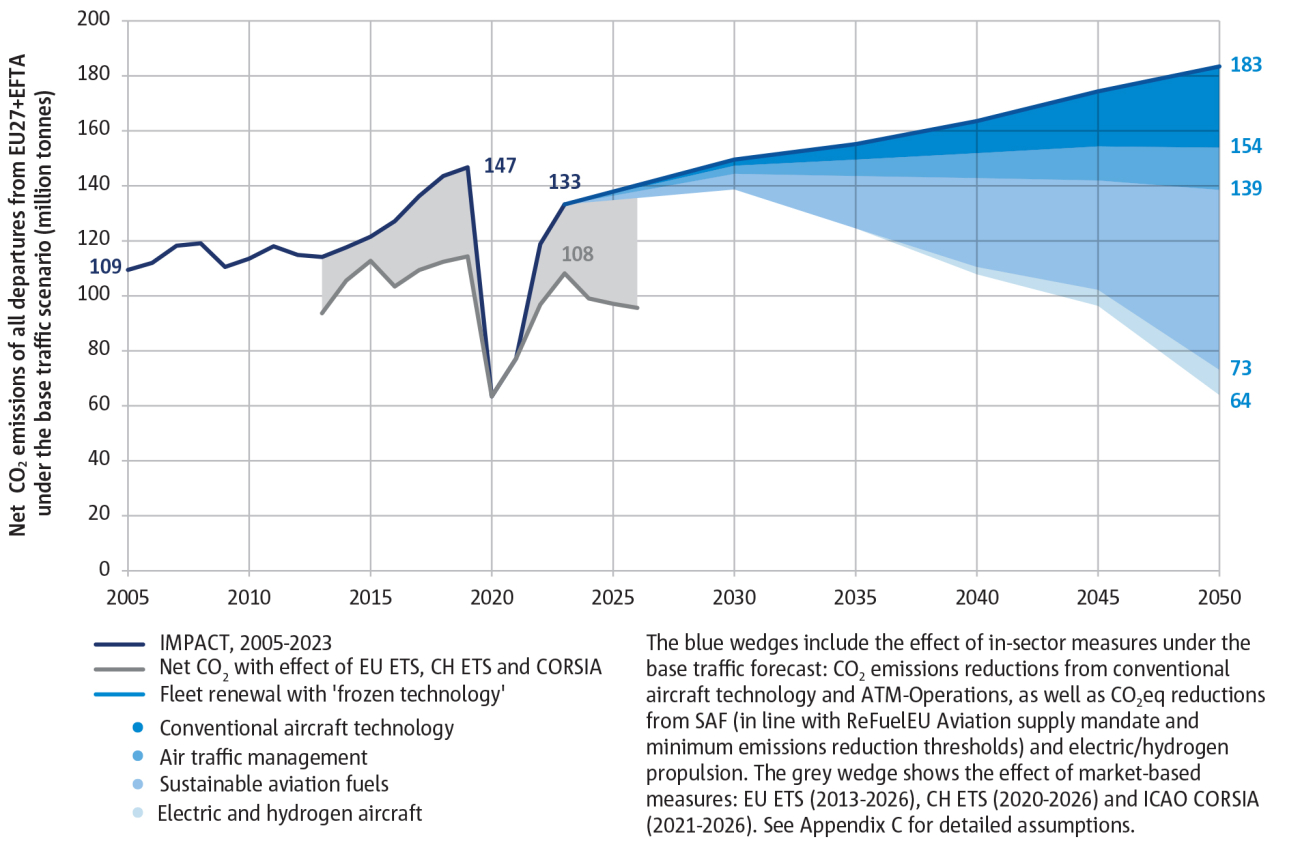
Figure 1.11
Mainline and low-cost operators account for 80% of total CO2 emissions
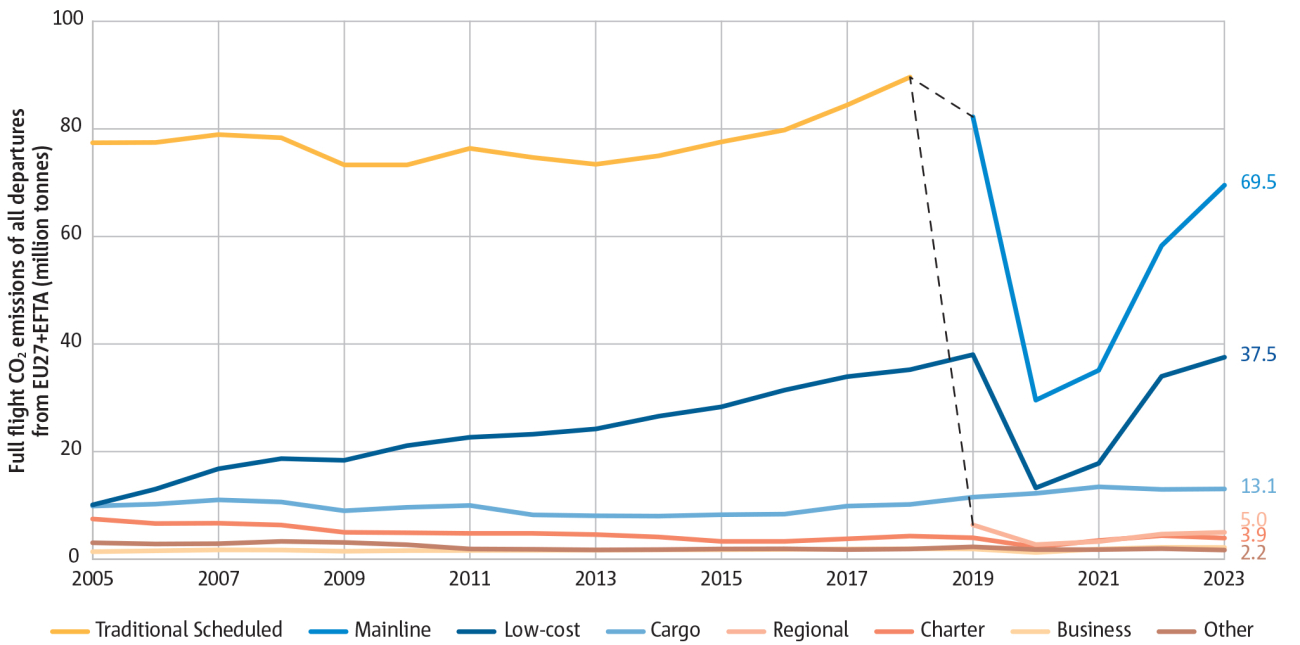
Figure 1.12
NOX emissions may continue to grow with traffic
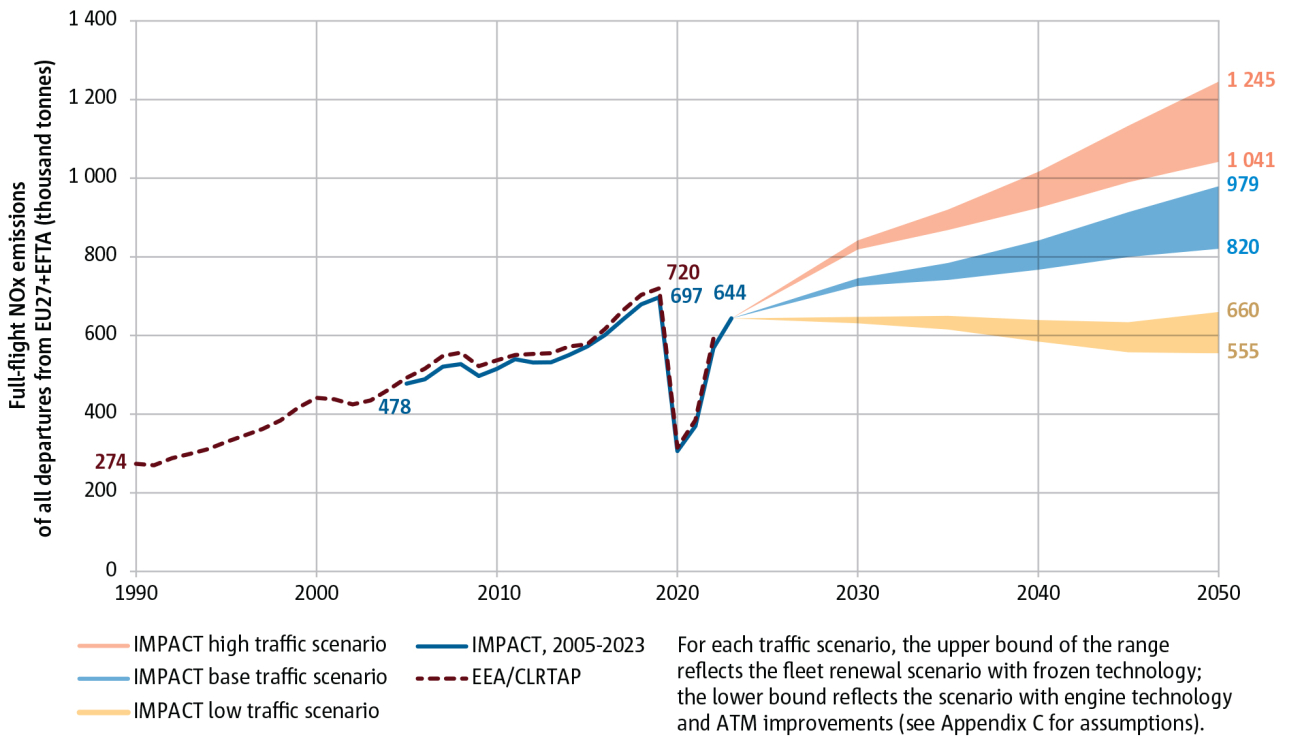
Figure 1.13
Single-aisle and twin-aisle jets generated over 90% of noise and emissions in 2023
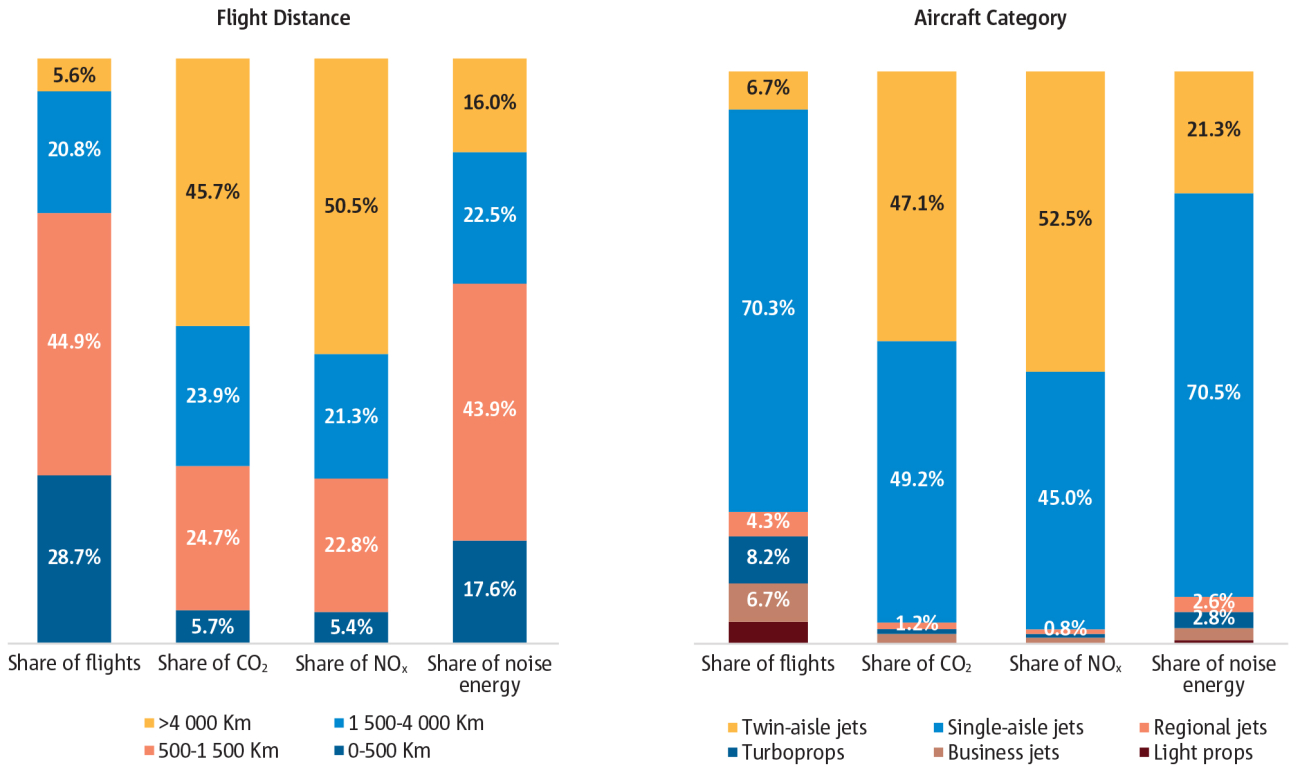
Figure 1.14
Extra-EU27+EFTA flights represented 23% of departures and 61% of CO2 emissions in 2023
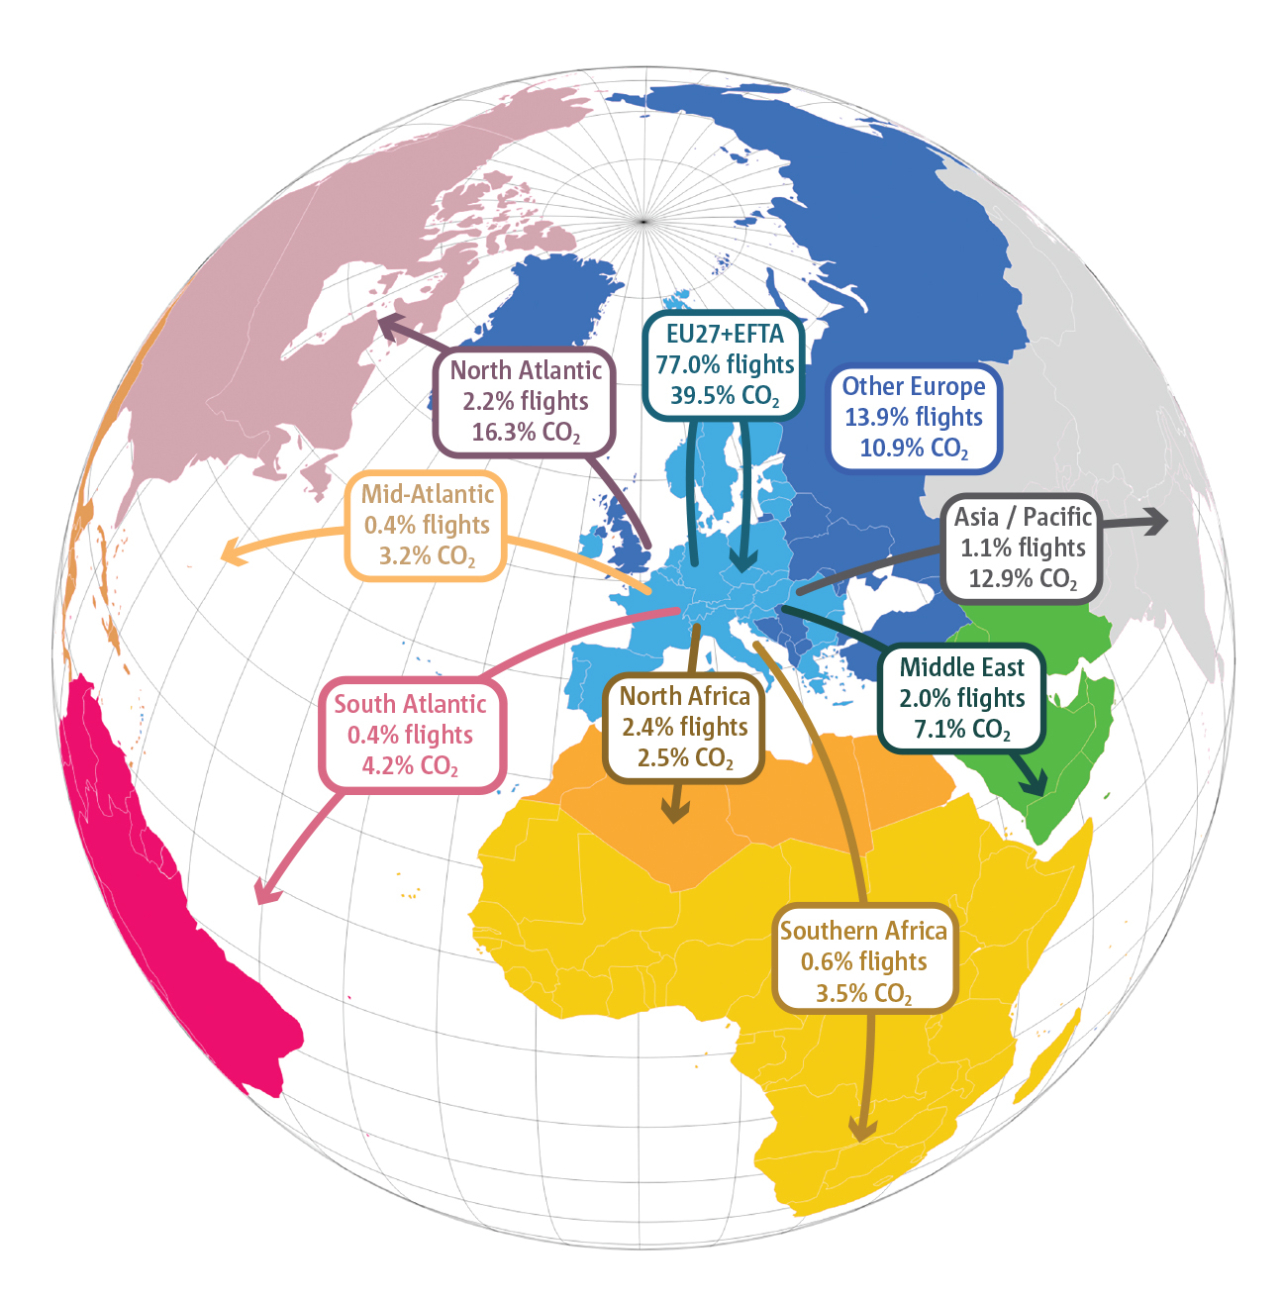
Figure 1.15
Summary of full-flight emission indicators (% change to 2005)
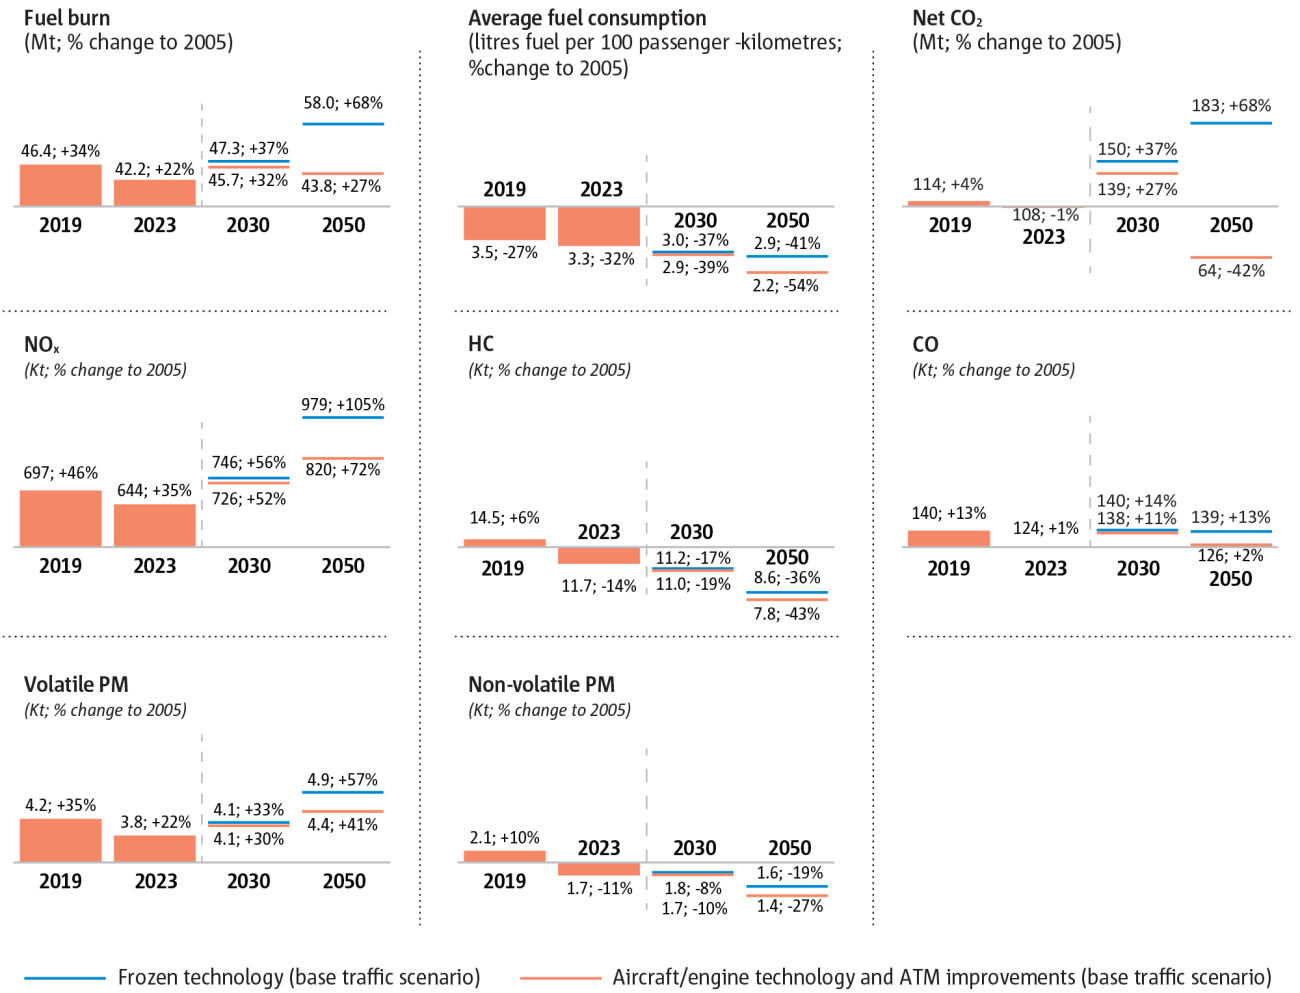
Figure 1.16
CO2 emissions continue to grow faster than noise energy, but slower than NOX