SES environmental performance and targets

The SES Performance and Charging Scheme 

[6]
 defines key performance indicators (KPIs) for air navigation services and network functions, which are used for performance target setting at Union-wide and local levels in the key performance areas (KPAs) of environment, safety, cost efficiency and capacity. SES Performance Scheme Reference Periods (RP) are divided into five year periods. This report captures the results of RP2 and RP3, while highlighting intentions for RP4 and preparations for future RP5 changes (e.g. safety monitoring but no KPA, climate and environmental KPA). The environmental performance dimension of SES involves both target setting to drive improvements as well as and the monitoring and reporting on environmental performance indicators.

reference period per year range table


During RP3, environmental performance has been measured through one KPI, namely horizontal en-route flight efficiency of the actual flight path (KEA). KEA measures the additional distance flown in comparison to the great circle distance (shortest distance between two airports).

The higher the KEA inefficiency value, the worse the performance. However, other factors such as wind, weather, airspace structures, and network constraints influence the optimum trajectory. One of the objectives of the SES2+ proposal from the Commission was to develop a more suitable KPI on environmental performance for RP4. However, due to the duration of the negotiations and adoption of the SES2+ legislation, this was not possible and is now planned for RP5.

Following the COVID pandemic, environmental performance measured against the KEA KPI deteriorated significantly in 2022 and 2023 (

). EU Member States were not able to meet, by a wide margin, the Unionwide environmental performance targets set for 2022 (2.37%) and for 2023 (2.40%). Unfortunately, the impact of the war in Ukraine and the subsequent restrictions in parts of EU airspace made it more difficult to assess whether ATM actions towards improving the KEA actually resulted in tangible benefits. The PRB estimates that over 26 million kilometres of additional distance was flown in 2022 as a result of missing the Union-wide target by 0.59%. This equates to approximately 118 million kilograms of excess fuel burnt (375 million kilograms of CO2).

The Performance Scheme includes various indicators that are only monitored at either EU-level or local level but with no binding targets. These include the average horizontal  en-route  flight efficiency of the last filed flight plan trajectory (KEP)2 and the shortest constrained trajectory (KES/SCR).3 As with all other indicators, KEP and KES/SCR (

) have been significantly affected by the war in Ukraine leading to general increases of inefficiency during 2022 and 2023, although there has been a reduction in the delta between KES/SCR and KEP. As with KEA, it is recognized that more suitable indicators are needed to give a clearer indication on the effectiveness of ANSP and Network Manager actions.

The share of flights completing Continuous Descent Operations (CDOs) in 2023 fell by only 0.03% compared to 2022 data. The trend in terms of monthly share of CDO flights during 2023 (

) was fairly steady at around 30-35%, even during the summer period with a significantly higher number of flights. Air Traffic Controllers (ATCOs) will endeavor to clear aircraft for a CDO when they can guarantee safe separation all the way to final approach. However, during busy periods, ATCOs may need to use alternative ATC procedures to maintain the required separation, such as radar vectoring and speed control, which are not compatible with CDOs. As such,   illustrates that there is a limited capacity to accommodate CDOs.

Restrictions on the number of CDOs are linked to the current ATM system. It is expected that with future Time-Based Operations (TBO), more CDOs would be facilitated by embedding them in aircraft fuel efficient trajectories.

Additional ASMA time, otherwise known as airborne holdings, has a direct impact in terms of increased fuel burn. There is a clear interest in finding a balance between regulating arrivals by absorbing delays on the ground and airborne delays during the approach phase. Airborne delays allow for tactical management of the arrival flow, potentially optimizing the approach sequence and maximizing runway throughput. However, excessive airborne delays are unnecessary and have a clear impact on emissions. As per ASMA, extended taxiout durations contribute to higher fuel consumption and CO2 emissions. Recognizing that establishing a departure sequence enhances runway efficiency and that airports may occasionally need to clear stands for arriving flights, striking a balance between ATC pre-departure delays to regulate runway traffic and added taxi-out times is essential for minimizing environmental impacts.

The evolution of both indicators follows a similar trend (

) with a slight increase during 2014-2019 followed by a significant decrease due to the drastic reduction in traffic during COVID. Traffic has since recovered such that it is only 10% below 2019 at the 40 busiest EU27+EFTA airports in 2023, while additional ASMA and taxi-out times are also increasing at the same time.

Significant variations exist between the top 40 busiest EU27+EFTA airports in terms of additional ASMA time (

).

It remains essential for the ATM industry to maintain and even strengthen its commitment to contribute to the achievement of the European Green Deal goals and a more sustainable future of the aviation. The RP4 Unionwide performance targets 

[42]
 reflect the ambition of enhancing environmental performance and sustainability while building up resilience and strengthening capacity as well as reducing costs. It should also be noted that PRB has developed a Traffic Light System to assess Member States environmental performance 
[43]
.

The PRB advice to the European Commission regarding the performance indicators for RP4 placed a focus on improving the ATM environmental performance by prioritising actions which enable airspace users to fly the most fuel-efficient trajectories, and thus reduce the fuel burn gate to gate 

[41]
. In the interest of better flight efficiency in European airspace, all efforts need to be made by ANSPs and the Network Manager to support fuel-efficient trajectories, avoiding detours and delays due capacity hotspots. 

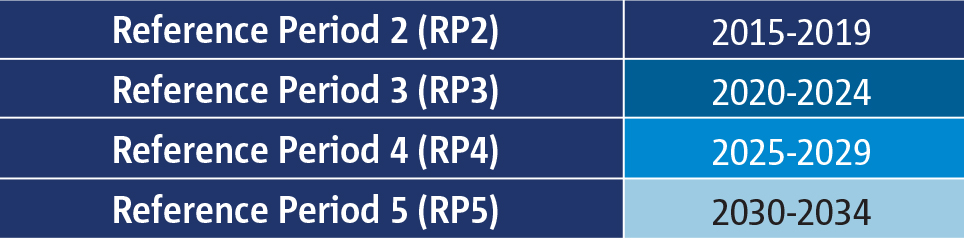
Given the interdependency between the environment and capacity KPAs, it is crucial to address the long-term capacity shortages faced by certain ANSPs in order to enable the required environmental performance improvements. Such capacity issues have been observed since the second SES Reference Period (2015-2019), and they have reemerged during the recovery from the COVID crisis due to insufficient Air Traffic Controllers (ATCOs) in the core area of Europe to adequately meet traffic demand.

Recognising the forecasted traffic growth during RP4, which may impact the complexity of operations, and the continued consequences of the war in Ukraine, the future RP4 environmental targets improve following a step-wise approach with KEA targets reducing from 2.80% for 2025 to 2.66% for 2029. Progress has also been made in the development of new and revised performance monitoring indicators (PIs), including within the environmental area, that draw on the results of a study conducted by the Commission. These are currently being discussed by the Single Sky Committee with a view to their possible use during RP4.

The new rules to be developed for the performance and charging scheme on the basis of the SES2+ Regulation will start to apply during RP5. This includes a single key performance area that would cover both environmental and climate aspects, as well as a requirement for binding targets for terminal air navigation services provided that adequate environmental indicators are identified and put in place.

The SES performance and charging scheme aims to capture the relationship between flight routing and environmental impacts, and existing indicators were previously regarded as reasonable proxy measures to incentivise ANSP efficiency. However, limitations with the current environmental KPI/PIs have been identified and were confirmed during the COVID pandemic, when some Member States were unable to meet their environmental targets despite a dramatic reduction in traffic. These weaknesses should be borne in mind when drawing conclusions on the basis of the existing KEA KPI, especially when considering the performance achieved at the level of an individual EU Member State’s airspace.

It is recognized that the SES performance scheme needs to be improved in terms of the ATM-related performance indicators for environment. KEA does not provide the needed granularity at national level to specifically assess the contribution of ATM to environmental efficiency. However, while this main KPI is not considered fit for purpose, gaining agreement on alternative has proved complicated. Work is now ongoing to find a more robust KPI which, after a period of monitoring and analysis during RP4, will be ready for performance target setting in RP5 and beyond.


2 The difference between the length of the en-route part of the last filed flight plan trajectory and the corresponding portion of the great circle distance, summed over all IFR flights within or traversing the European airspace.
3 The difference between the length of the en-route part of the shortest constrained route available for flight planning, as calculated by the path finding algorithms and flight plan validation systems of the Network Manager, measured between the exit and entry points of two terminal manoeuvring areas, and the corresponding portion of the great circle distance summed over all IFR flights within or traversing the European airspace.