As we work together as a community to fly safely and prevent accidents, it's important to understand where to focus our efforts. In this section you will find imformation about the main safety risks and safety statistics for gliders and sailplanes.
Key Risk Areas
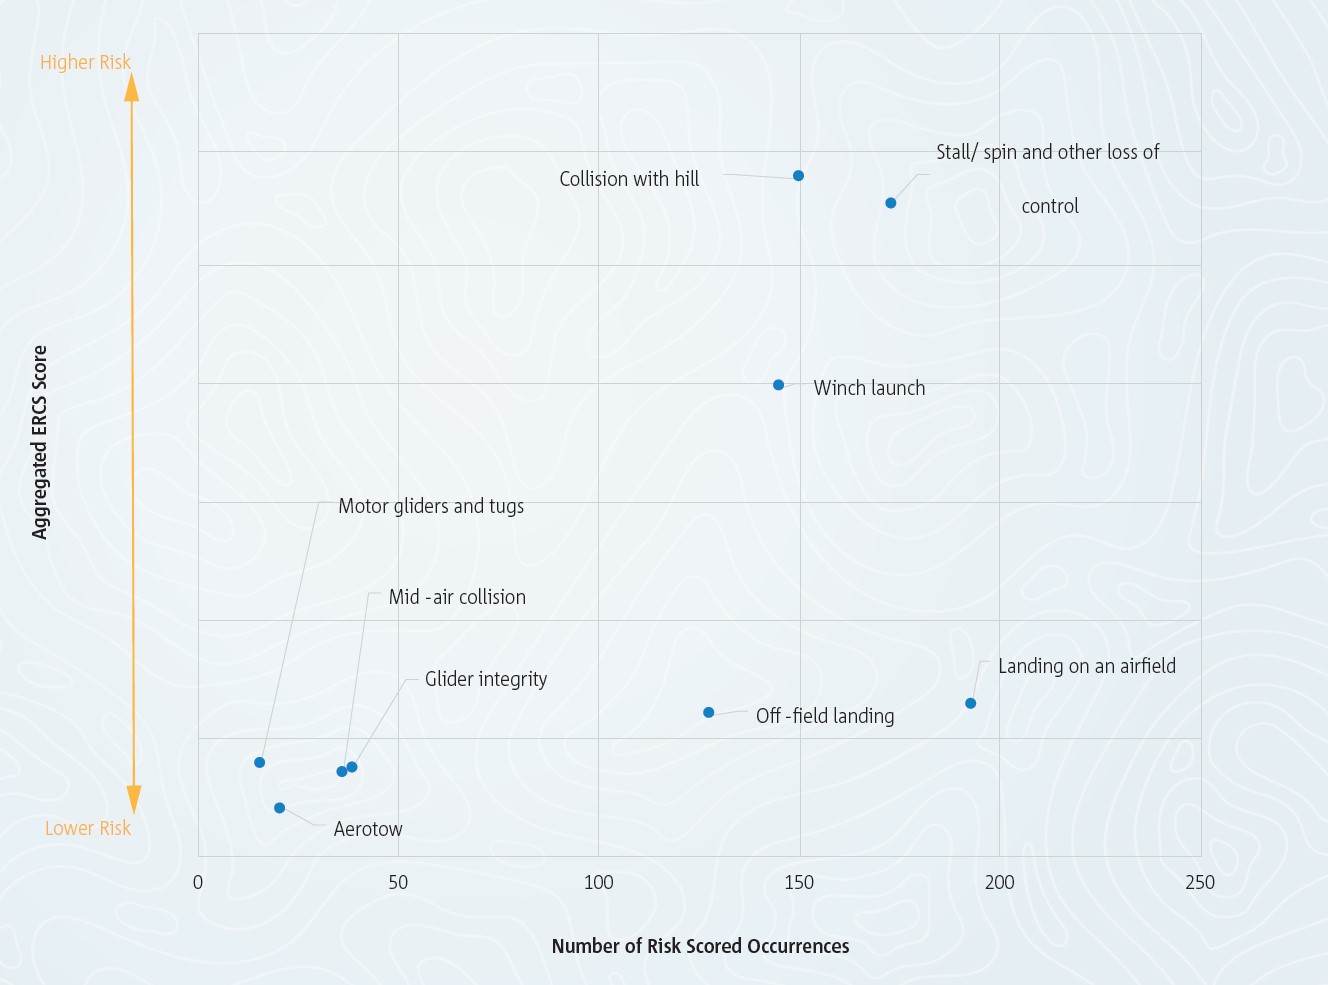
The graph below highlights the level of risk in the accidents and serious against the number of occurrenes. This means that we should focus our efforts on those towards the top right of the graph. The main accident outcomes are:
- Stall/ spin or other loss of control.
- Collision with hill.
- Winch launch.
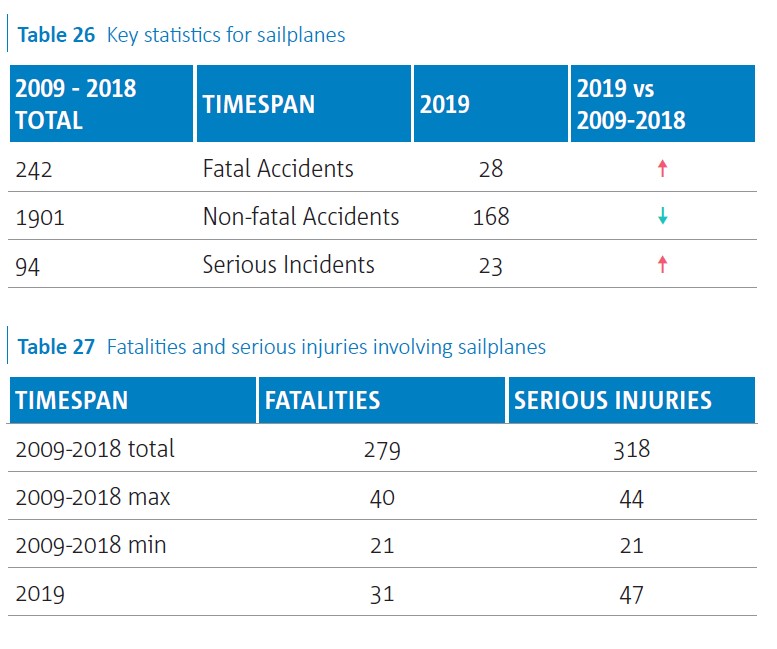
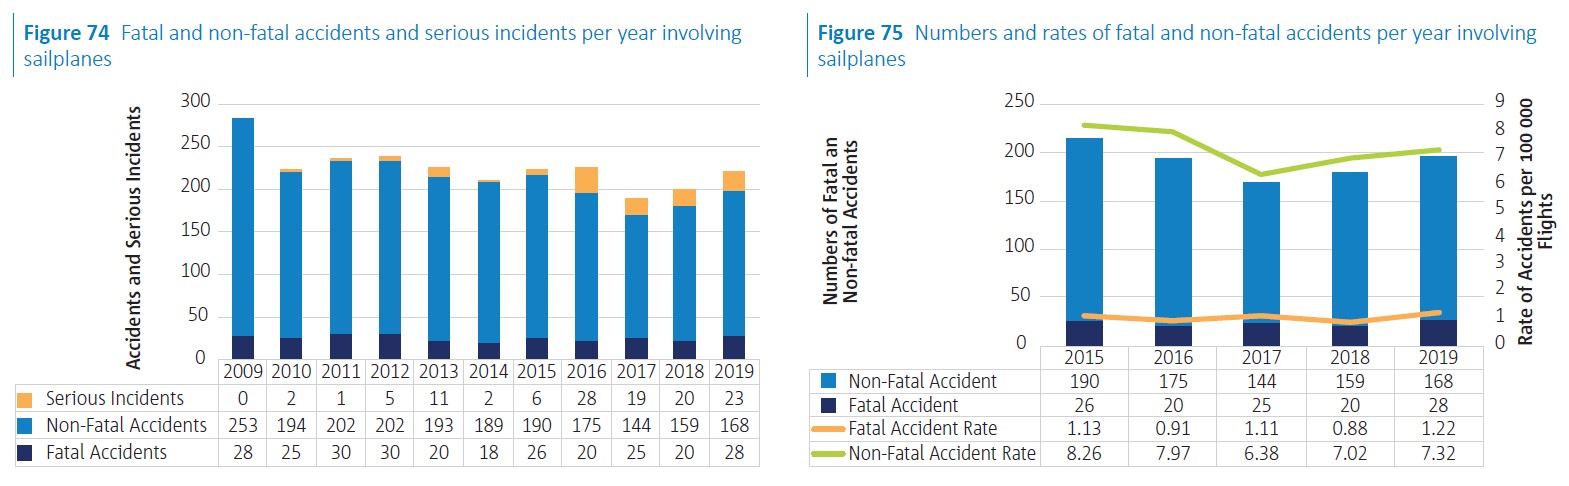
Key Statistics
Below you can see the key statistics from the EASA Annual Safety Review 2020 - this review covers accidents and serious incidents up to 2019 and the report was published in 2020. In 2019, there were 28 fatal accidents, 168 non-fatal accidents and 23 serious incidents. Tragically, there were 31 fatalities and all our efforts go into reducing this number for the future. The graphs after the table provide you with the evolution of the data over the last 10 years.