


 124 / 168

Annual Safety Review 2014
ATM
PAGE
122
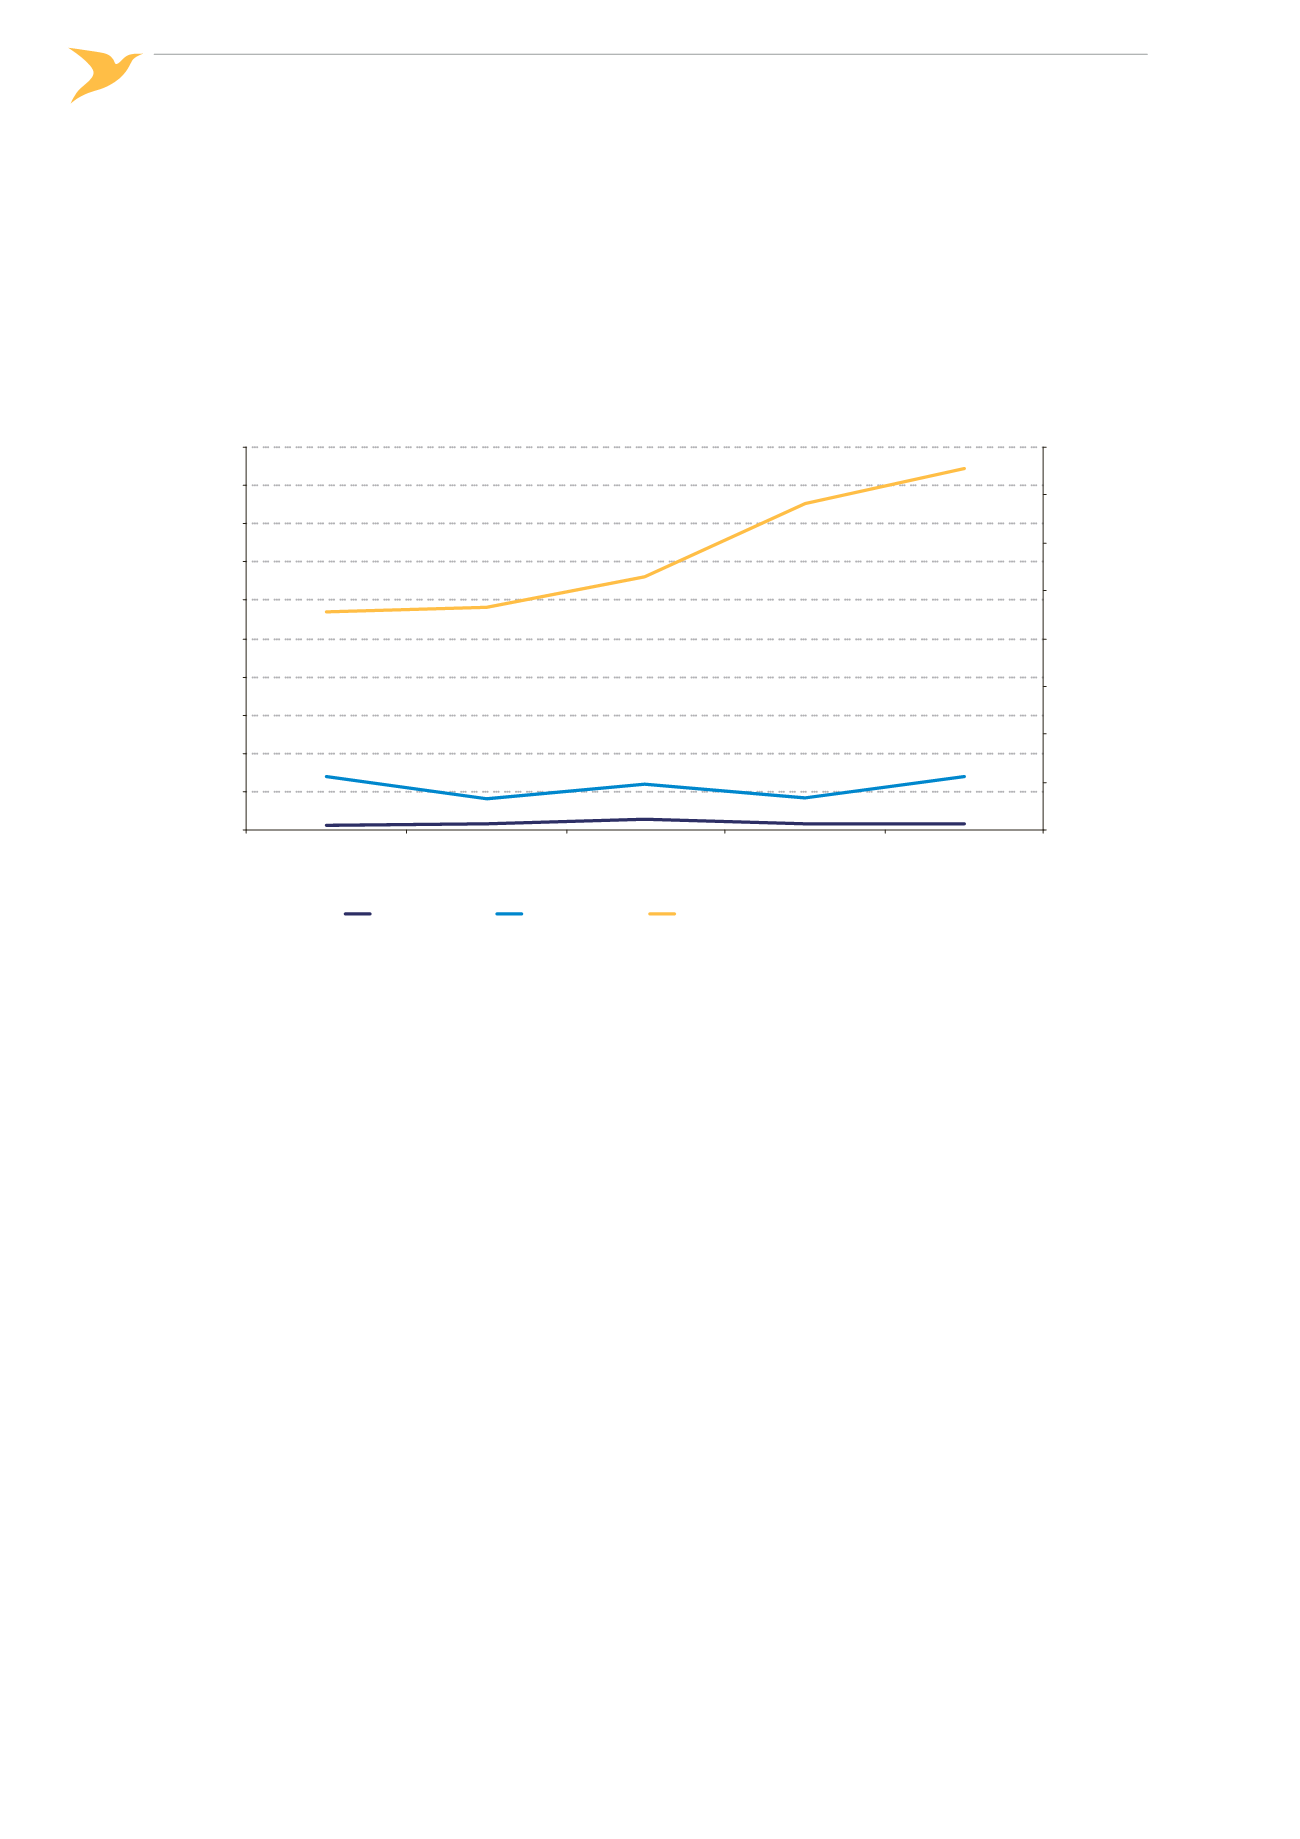
Figure 47 shows the rate of deviations from ATC clearances and the increase in reporting rate is clearly observa‑
ble. The rate of major incidents has also increased while the rate of serious incidents has decreased.
´
´
Figure 47:
Rate of deviations from ATC clearance per million flight hours in EASA MS FIRs,
2010-2014
0
50
100
150
200
250
300
350
400
0
5
10
15
20
25
30
35
40
45
50
2010
2011
2012
2013
2014
All Deviations from ATC Clearance
per Million Flight Hours
Severity A and B Deviations from ATC Clearance
per Million Flight Hours
Year
Severity A
Severity B
All Deviations from ATC Clearance