


 122 / 168

Annual Safety Review 2014
ATM
PAGE
120
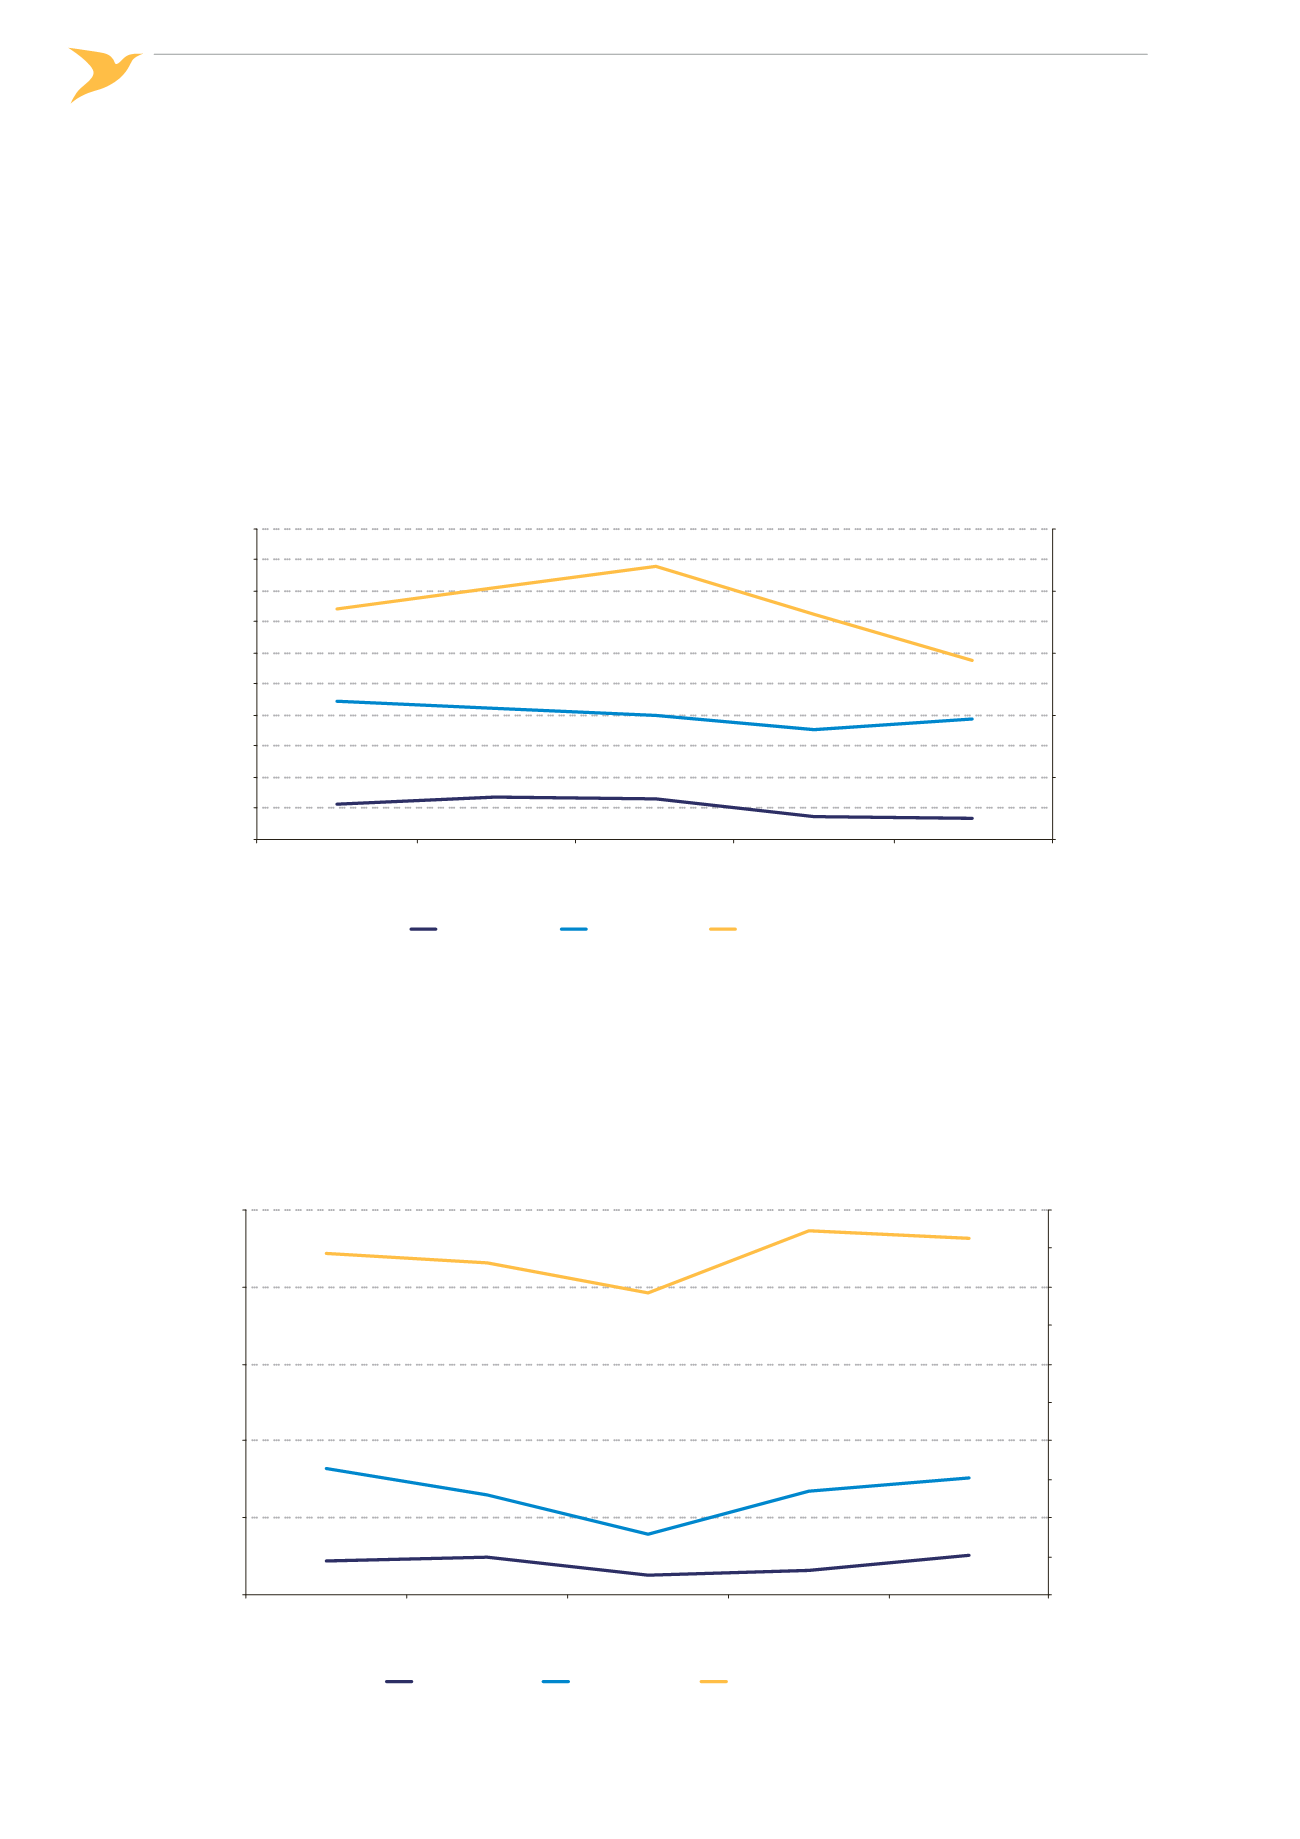
Occurrence Rates ATM
Comparing the number of incidents with the level of traffic can provide meaningful results in terms of safety
trends. The trends shown by the figures are the rate of incidents reported per million flight hours independent
of their severity, and the rate of risk bearing incidents (severity A and B). For the incident category of Runway In‑
cursions, a rate per million aircraft movements (departures/arrivals) is being used.
´
´
Figure 43:
Rate of ATM-related occurrences per year in EASA MS FIRs, 2010-2014
0
500
1000
1500
2000
2500
0
10
20
30
40
50
60
70
80
90
100
2010
2011
2012
2013
2014
All ATM Occurrences per Million Flight Hours
Severity A and B ATM Occurrences
per Million Flight Hours
Year
Severity B
All ATM Occurrences
Severity A
Figure 44 shows the rate of Runway Incursions per million flights. It is useful to calculate the rate using the num‑
ber of movements or flights as this represents the frequency with which a runway is being used. The European
Aviation Safety Plan (EASp) identifies Runway Incursions as being one of the five operational safety risks for Com‑
mercial Air Transport (CAT) aircraft.
´
´
Figure 44:
Rate of runway incursions per million flights in EASA MS FIRs, 2010-2014
0
10
20
30
40
50
60
70
80
90
100
0
3
6
9
12
15
2010
2011
2012
2013
2014
All Runway Incursions
per Million Aircraft Movements
Severity A and B Runway Incursions
per Million Aircraft Movements
Year
Severity A
Severity B
All Runway Incursions