


 129 / 168

PAGE
127
´
´
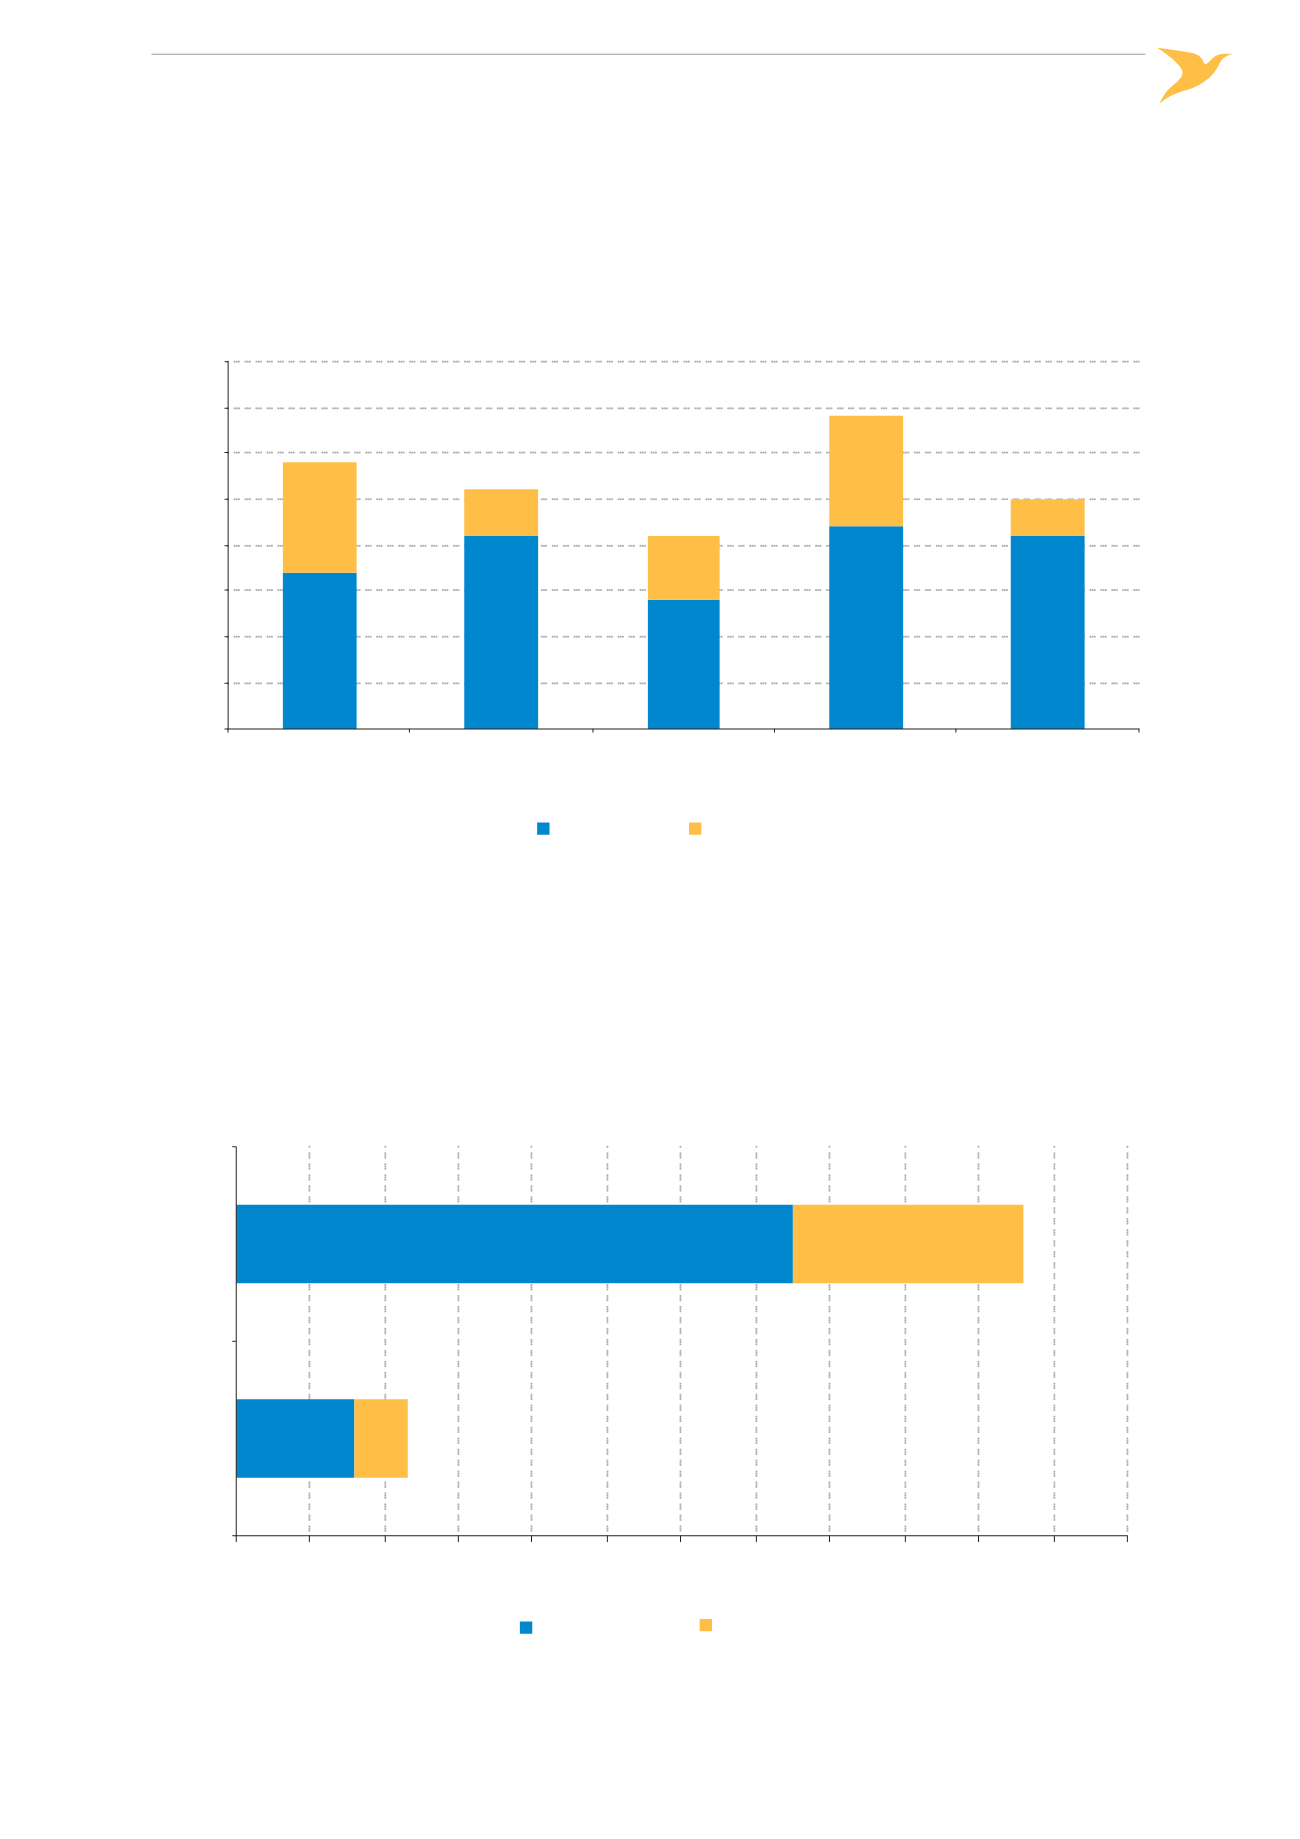
Figure 48:
Number of runway excursion accidents and serious incidents per year at EASA
MS aerodromes, 2010-2014
0
5
10
15
20
25
30
35
40
2010
2011
2012
2013
2014
Number of Occurrences
Year
Accident
Serious Incident
Phase of Flight
82 percent of Runway Excursion accidents and serious incidents occurred during landing while 18 percent oc‑
curred during take‑off.
´
´
Figure 49:
Runway excursions at EASA MS aerodromes by phase of flight, 2010-2014
0
10
20
30
40
50
60
70
80
90
100
110
120
Take-o
Landing
Number of Accidents and Serious Incidents
Accident
Serious Incident