


 123 / 168

PAGE
121
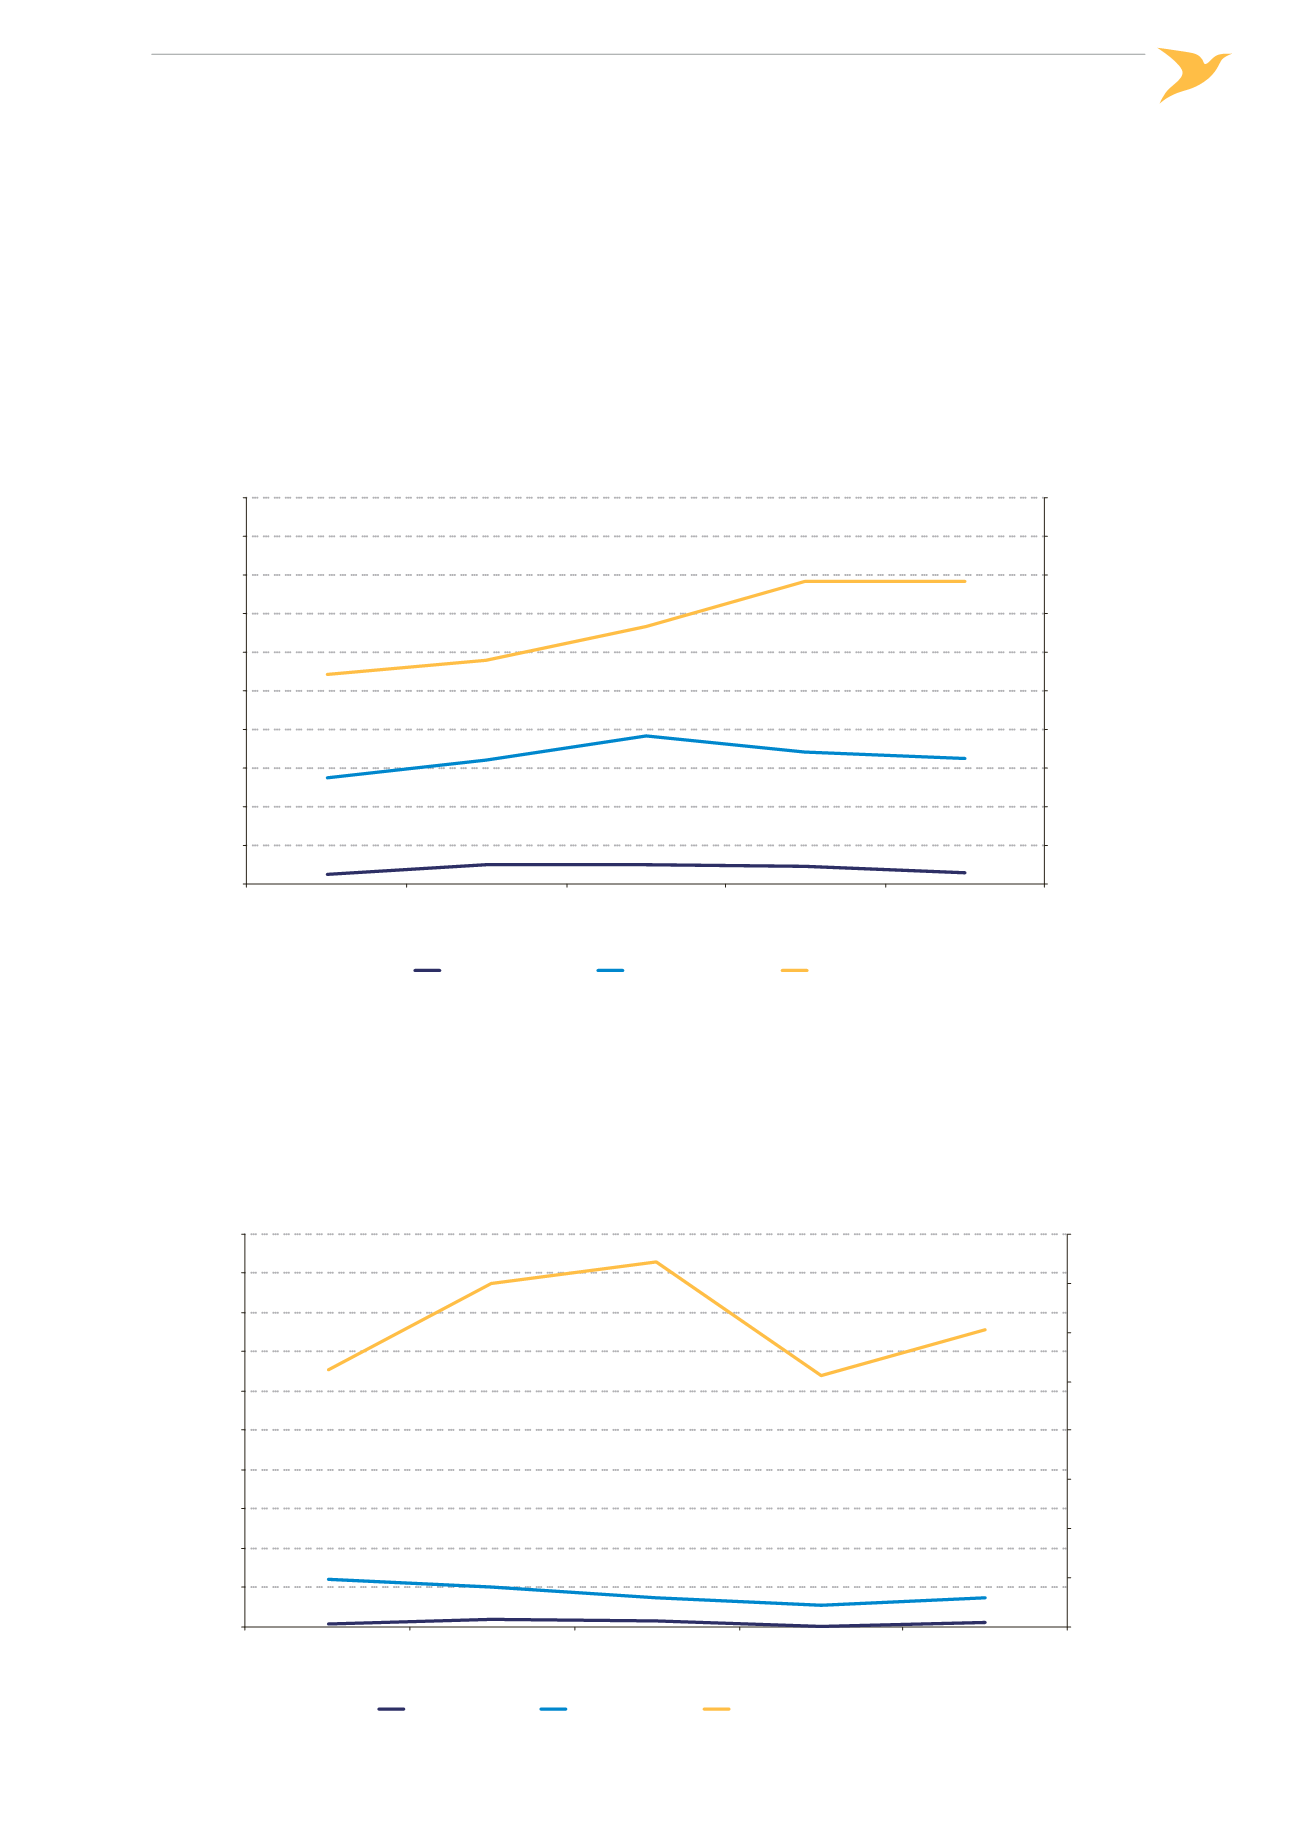
Figure 45 shows the rate of Separation Minima Infringements per million flight hours. It is useful to calculate this
rate using the number of flight hours as this best represents the timeframe during which the airspace is actual‑
ly being used by an aircraft. A Separation Minima Infringement occurrences infers that the minimum separation
between aircraft has been lost.
´
´
Figure 45:
Rate of separation minima infringements per million flight hours per year
in EASA MS FIRs, 2010-2014
0
20
40
60
80
100
120
140
160
180
200
0
5
10
15
20
25
30
35
40
45
50
2010
2011
2012
2013
2014
All Separation Minima Infringements
per Million Flight Hours
Severity A and B Separation Minima Infringements
per Million Flight Hours
Year
Severity A
Severity B
All SMI
Figure 46 shows the rate of reported Airspace Infringements for the period 2003-2012 and indicates that the
overall reporting rate of this type of incident has remained steady over the five year period. It also shows that the
rate of occurrences that have been RAT Severity classified as A or B has remained relatively steady.
´
´
Figure 46:
Rate of airspace infringements per million flight hours in EASA MS FIRs,
2010-2014
0
50
100
150
200
250
300
350
400
0
5
10
15
20
25
30
35
40
45
50
2010
2011
2012
2013
2014
All Airspace Infringements per Million Flight Hours
Severity A and B Airspace Infringements per
Million Flight Hours
Year
Severity A
Severity B
All Airspace Infringements