


 119 / 168

PAGE
117
Phase of Flight
Table 41 shows that the total number of accidents and serious incidents was close to the average of the preced‑
ing ten-year period of 2004-2013. In comparing 2014 with the 2004-2013 average, differences can be seen in the
en route and landing phases of flight. While en route accidents and serious incidents approximately halved in
comparison with the preceding ten-year period, landing accidents and serious incidents almost doubled.
´
´
Table 41:
EASA MS ATM accidents and serious incidents per phase of flight detection
Phase of Flight
Accidents and Serious Incidents
2004-2013 Average
2014
Standing
0.7
0
Taxi
6.0
7
Take‑off
8.8
7
En route
15.6
8
Manoeuvring
0.4
0
Approach
12.9
15
Landing
3.7
8
Post‑impact
0.0
0
Unknown
1.7
2
´
´
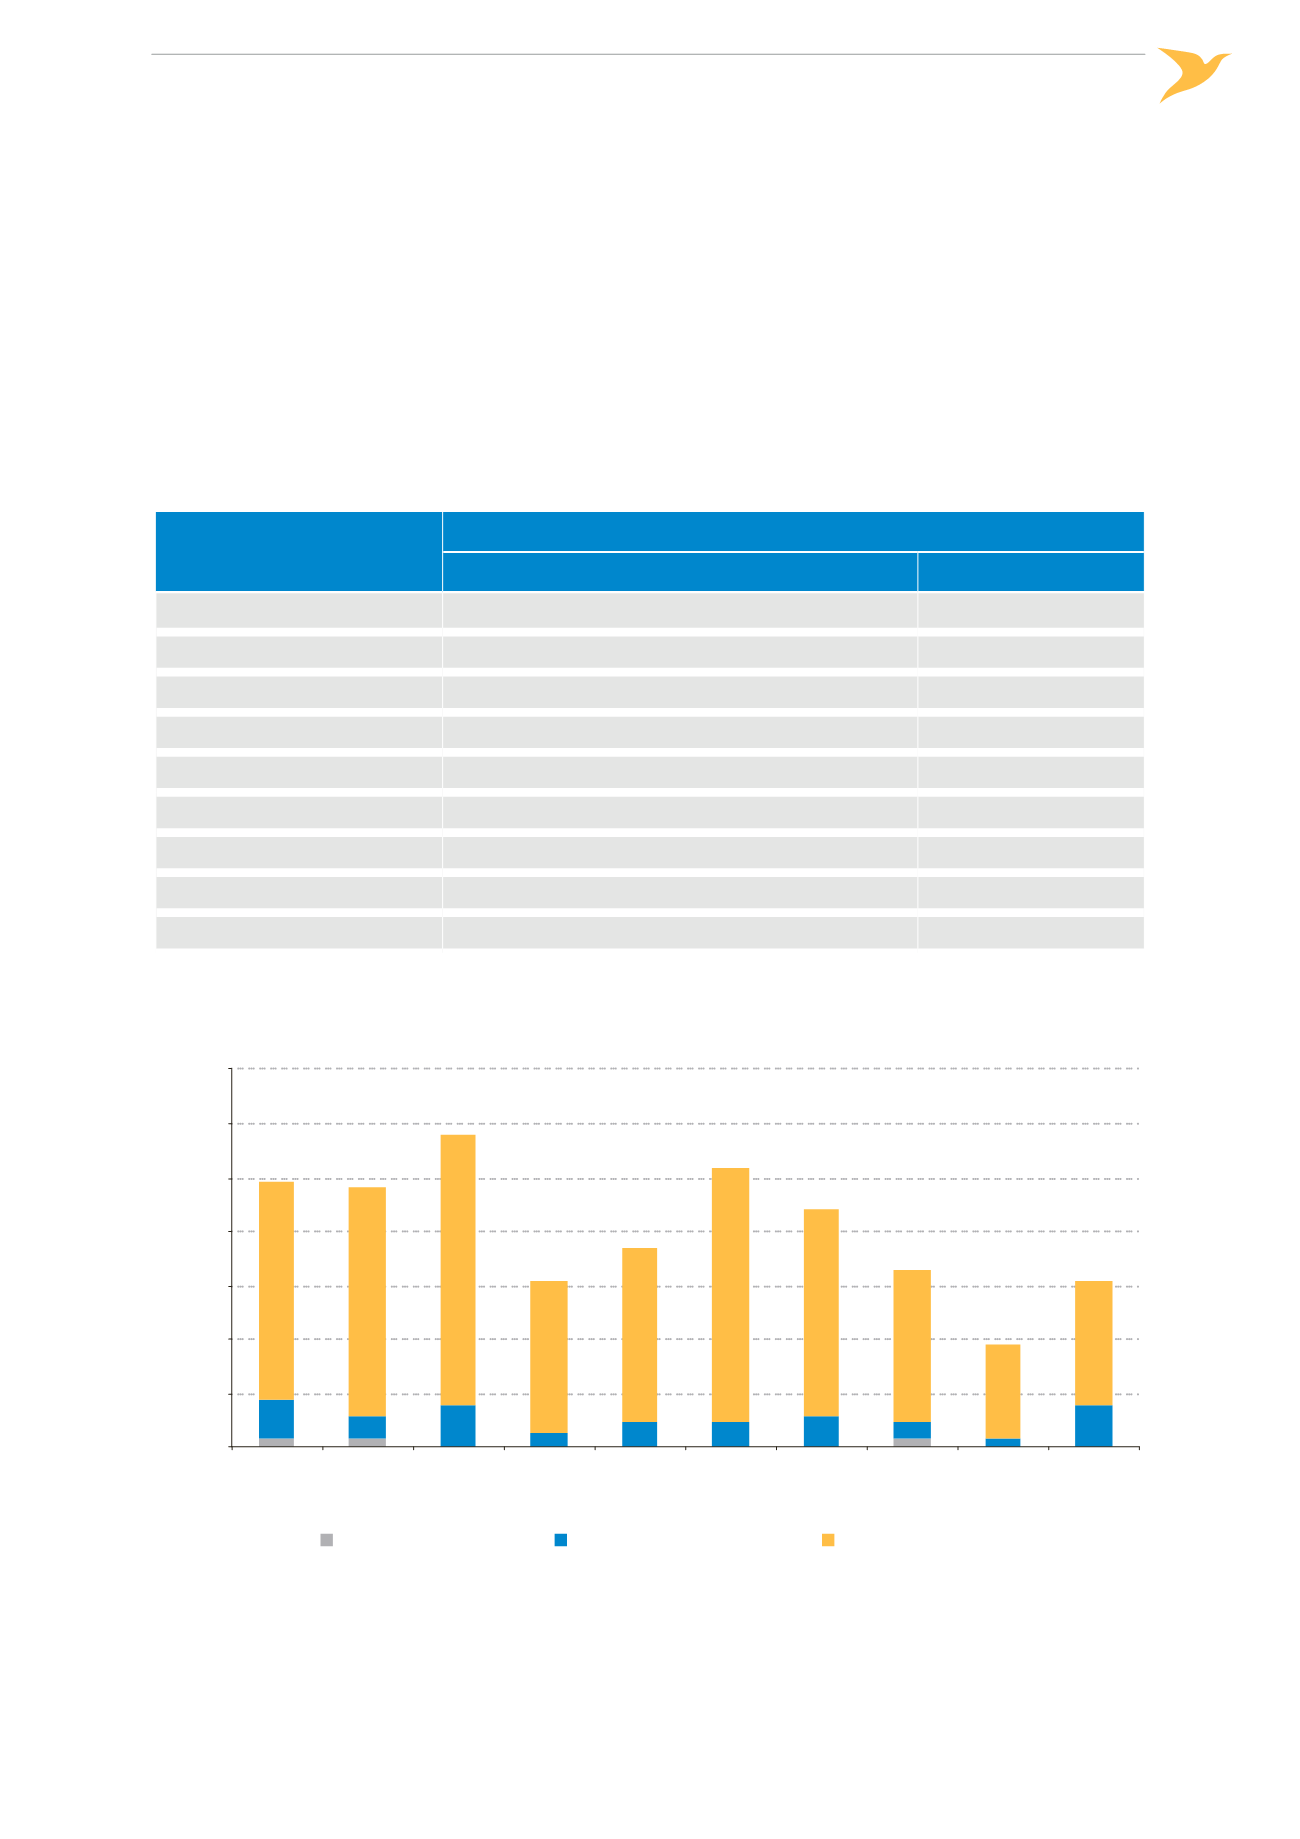
Figure 40:
Number of ATM accidents and serious incidents per year, 2005-2015
0
10
20
30
40
50
60
70
2005
2006
2007
2008
2009
2010
2011
2012
2013
2014
Number of Accidents and Serious Incidents
Year
Serious Incidents
Non-fatal Accidents
Fatal Accidents