


 135 / 168

PAGE
133
´
´
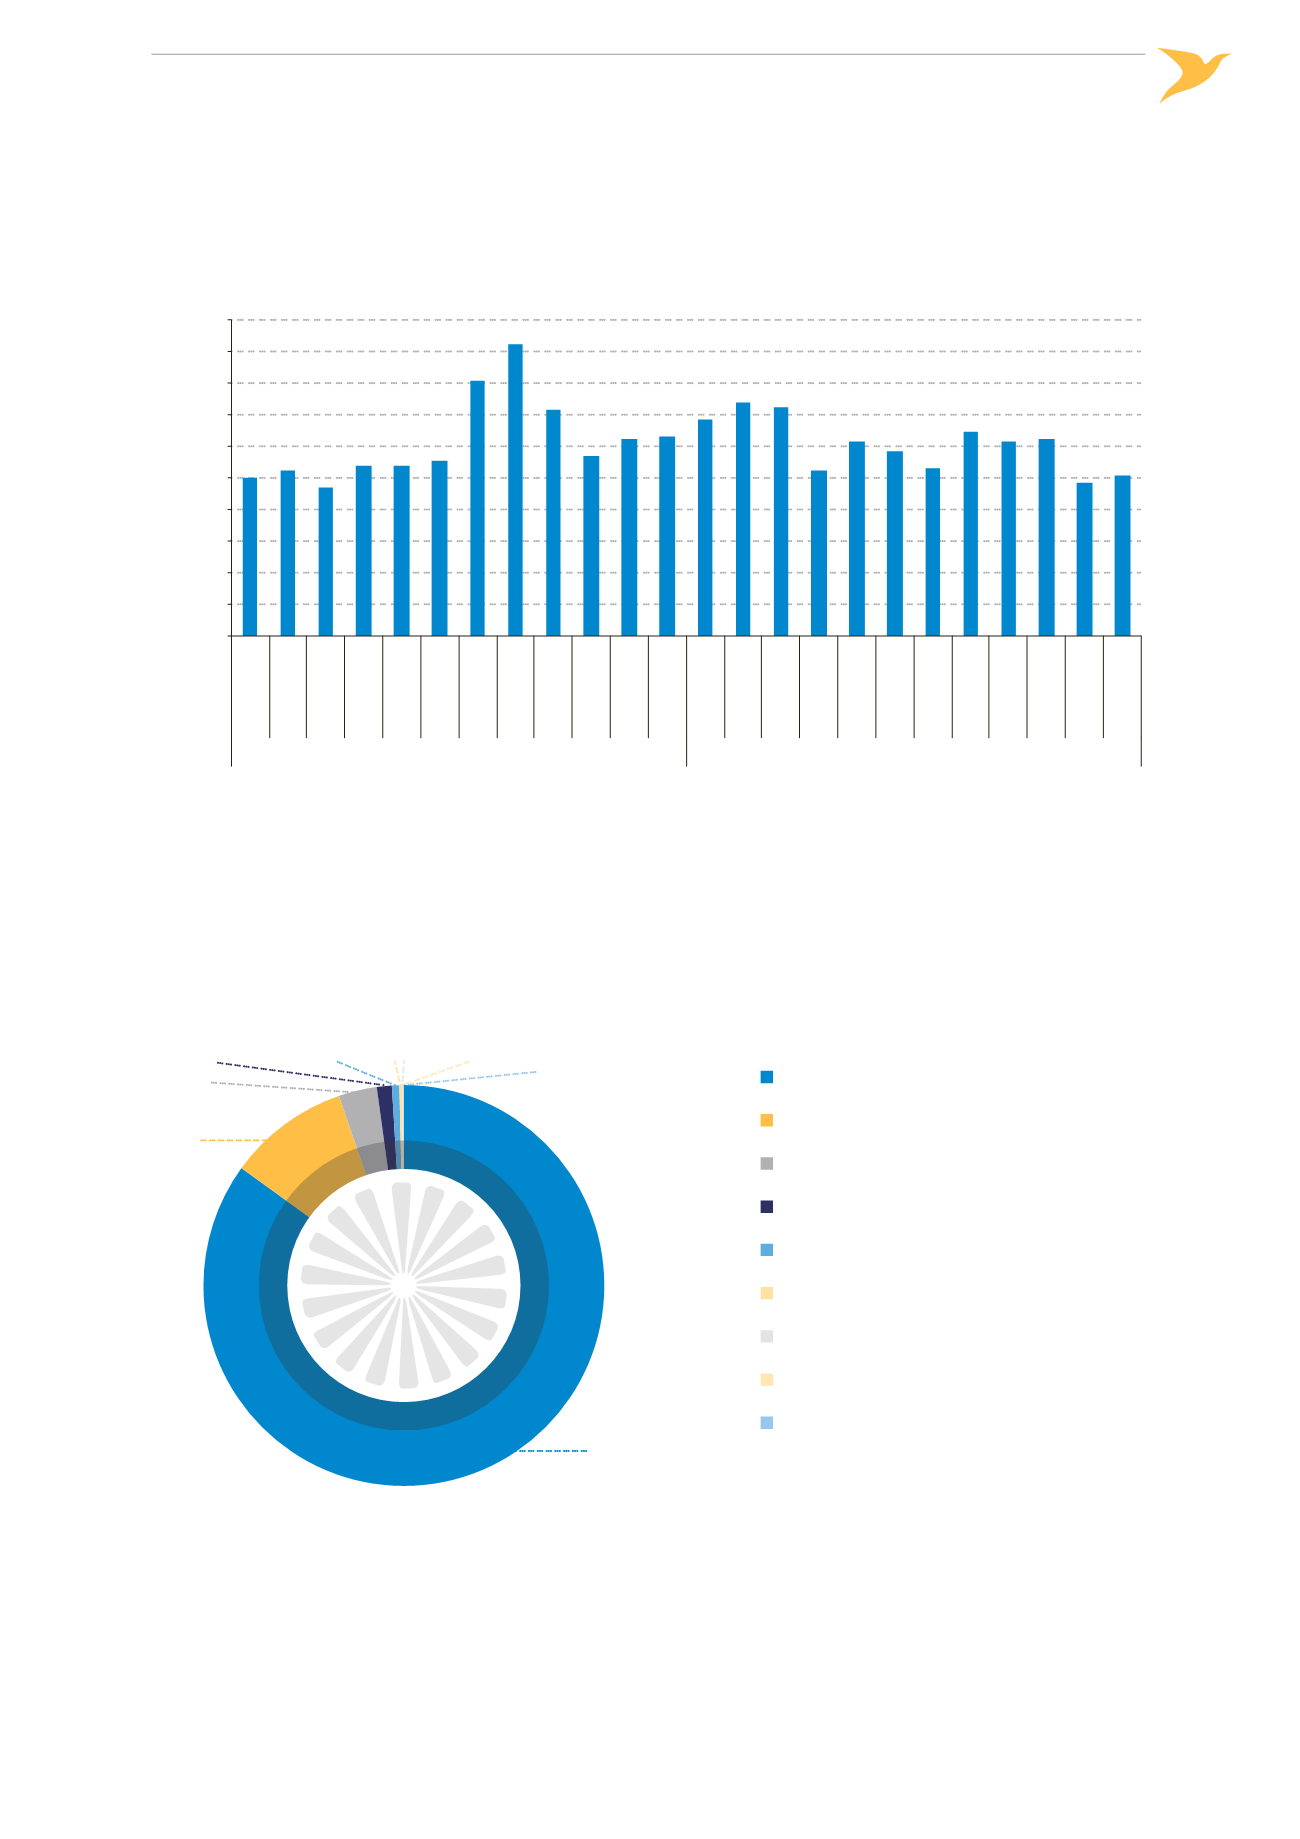
Figure 52:
Number of IORS reports per month Jan 2013 – Dec 2014
0
50
100
150
200
250
300
350
400
450
500
January
February
March
April
May
June
July
August
September
October
November
December
January
February
March
April
May
June
July
August
September
October
November
December
2013
2014
Number of Reports
Month and Year
Figure 52 shows the number of reports recorded in the Agency’s IORS system for the years 2013 and 2014 by
month. Typically the summer and winter holiday months are the periods with the highest aviation activity and
this is reflected in the increased number of reports received during these times.
´
´
Figure 53:
Number of IORS reports by reporting entity, 2013-2014
2 394
276
87
34
17
6 2
1
1
Aircraft designer/ builder/ maintainer
Maintainer
National Aviation Authority
Other
Operator/ Commander of aircraft
Air Navigation Safety Provider
ATM equipment maintainer
Airport Manager
Controller/ Flight information ocer
Occurrences are reported to the Agency by the organisations for which the Agency is the competent authority.
The majority of occurrences come from Design Approval Holders (Aircraft designer/builder/maintainer) and For‑
eign Maintenance organisations as can be seen in Figure 53.