


 43 / 168

PAGE
41
Key Statistics Aeroplanes
The fatal accident rate has remained stable across the ten‑year period and one fatal accident occurred in 2014
that involved an EASA AOC holder. Despite the stability of the data, the operational nature of this tragic event
should remind all stakeholders, especially the front‑line organisations and the aviation safety regulators, of their
key role in ensuring and improving aviation safety.
´
´
Table 4:
EASA MS CAT accidents per occurrence category
Fatal Accidents
Non‑Fatal Accidents
Serious Incidents
2014
1
26
66
2004-2013 average
1.2
22.6
78.1
The number of fatal accidents in 2014 remains below the ten‑year average, although the number of non‑fatal
accidents in 2014 is slightly above the average for the same ten‑year period. The number of serious incidents re‑
corded in 2014 is more than 15% lower than the ten‑year average, decreasing from around 78 to 66. The 2014
figure is located in the lower part of the historical range of between 60 to 100 serious incidents a year.
´
´
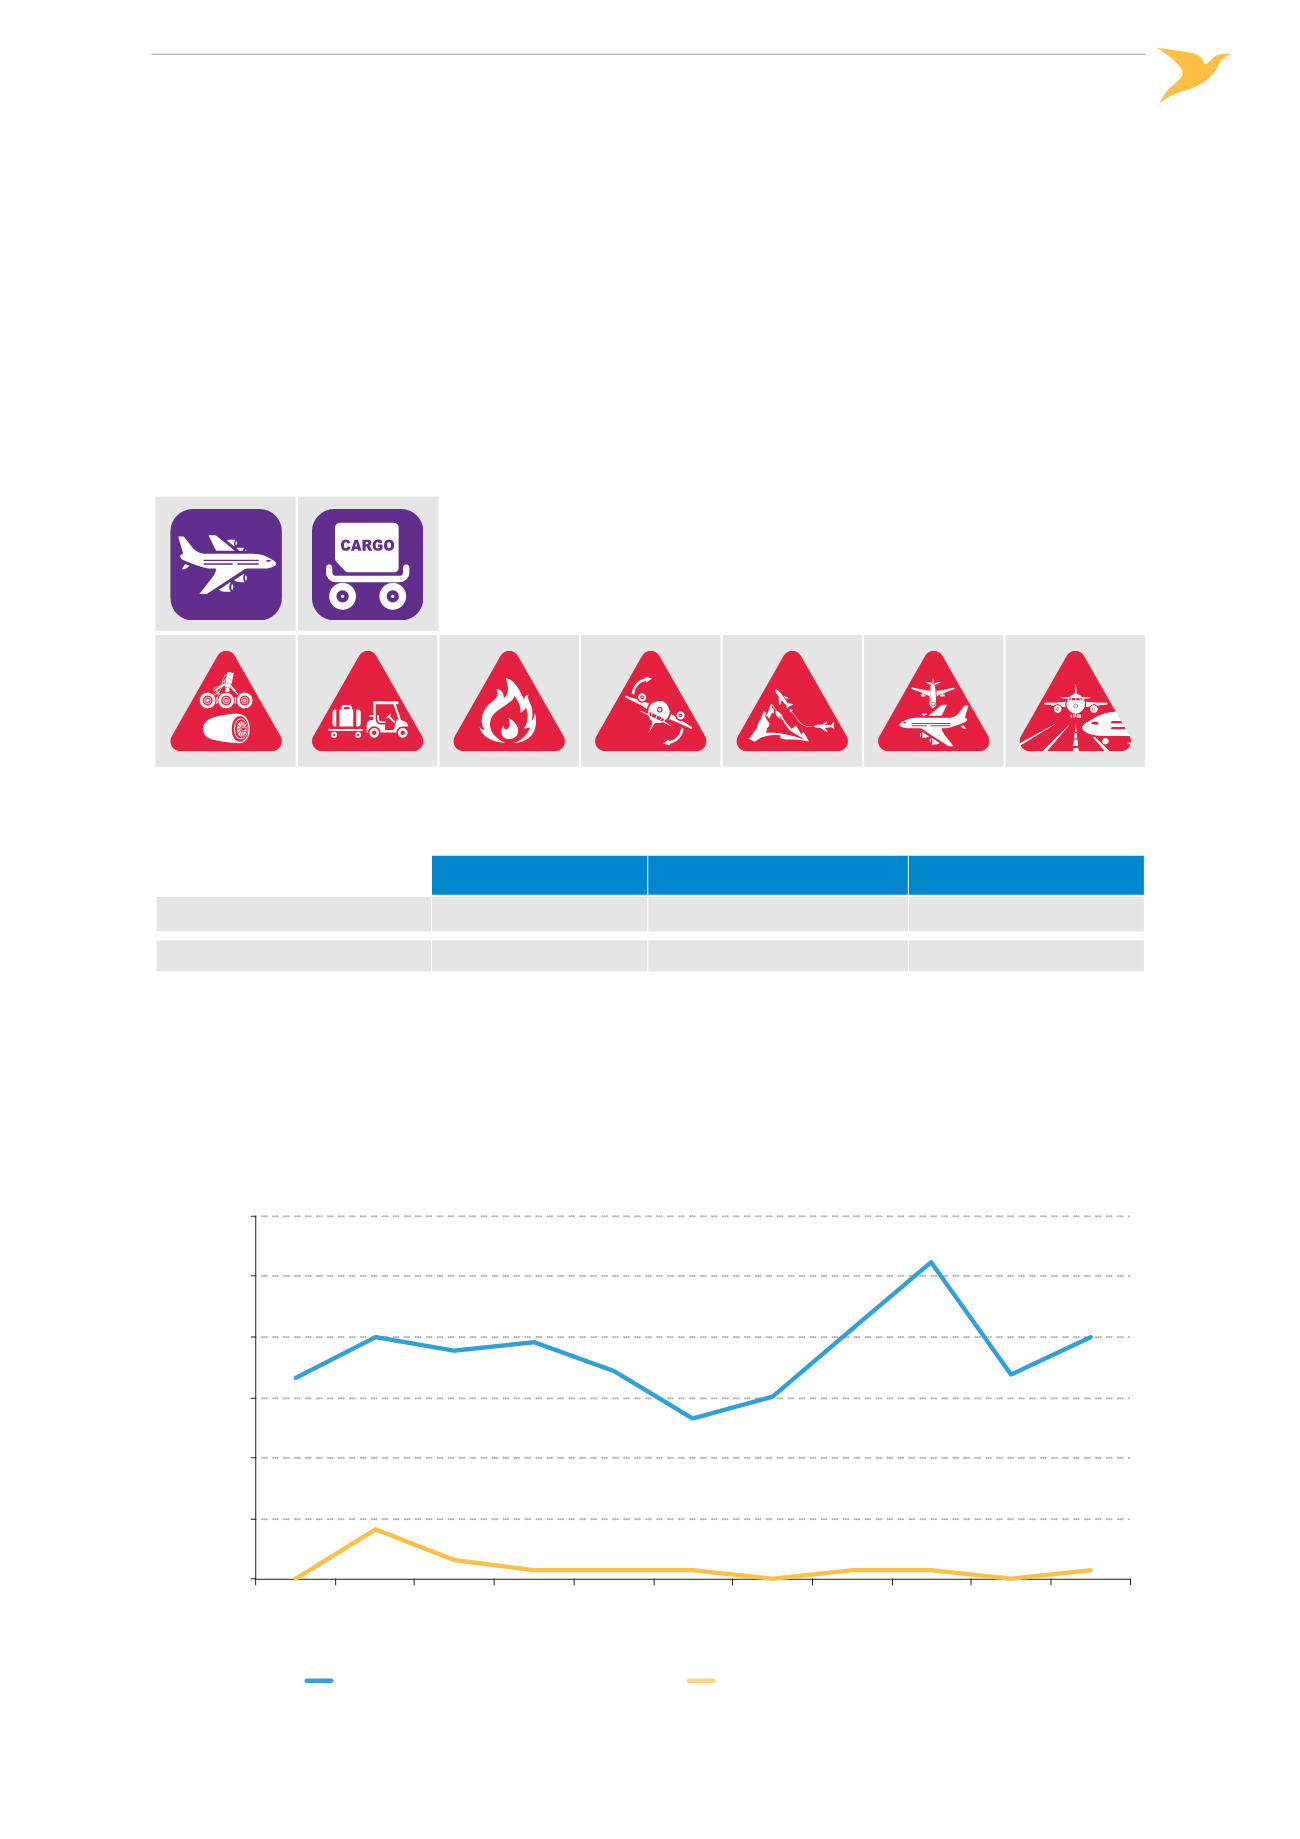
Figure 6:
Evolution of the accident rates for MS over the last 11 years
Year
2004
2005
2006
2007
2008
2009
2010
2011
2012
2013
2014
Accident Rate (per 10 million movements)
Fatal Accident Rate (per 10 million movements)
0
10
20
30
40
50
60
Accidents per 10 Million Movements (MS)