


 38 / 168

Annual Safety Review 2014
EASA Member State Overview
PAGE
36
´
´
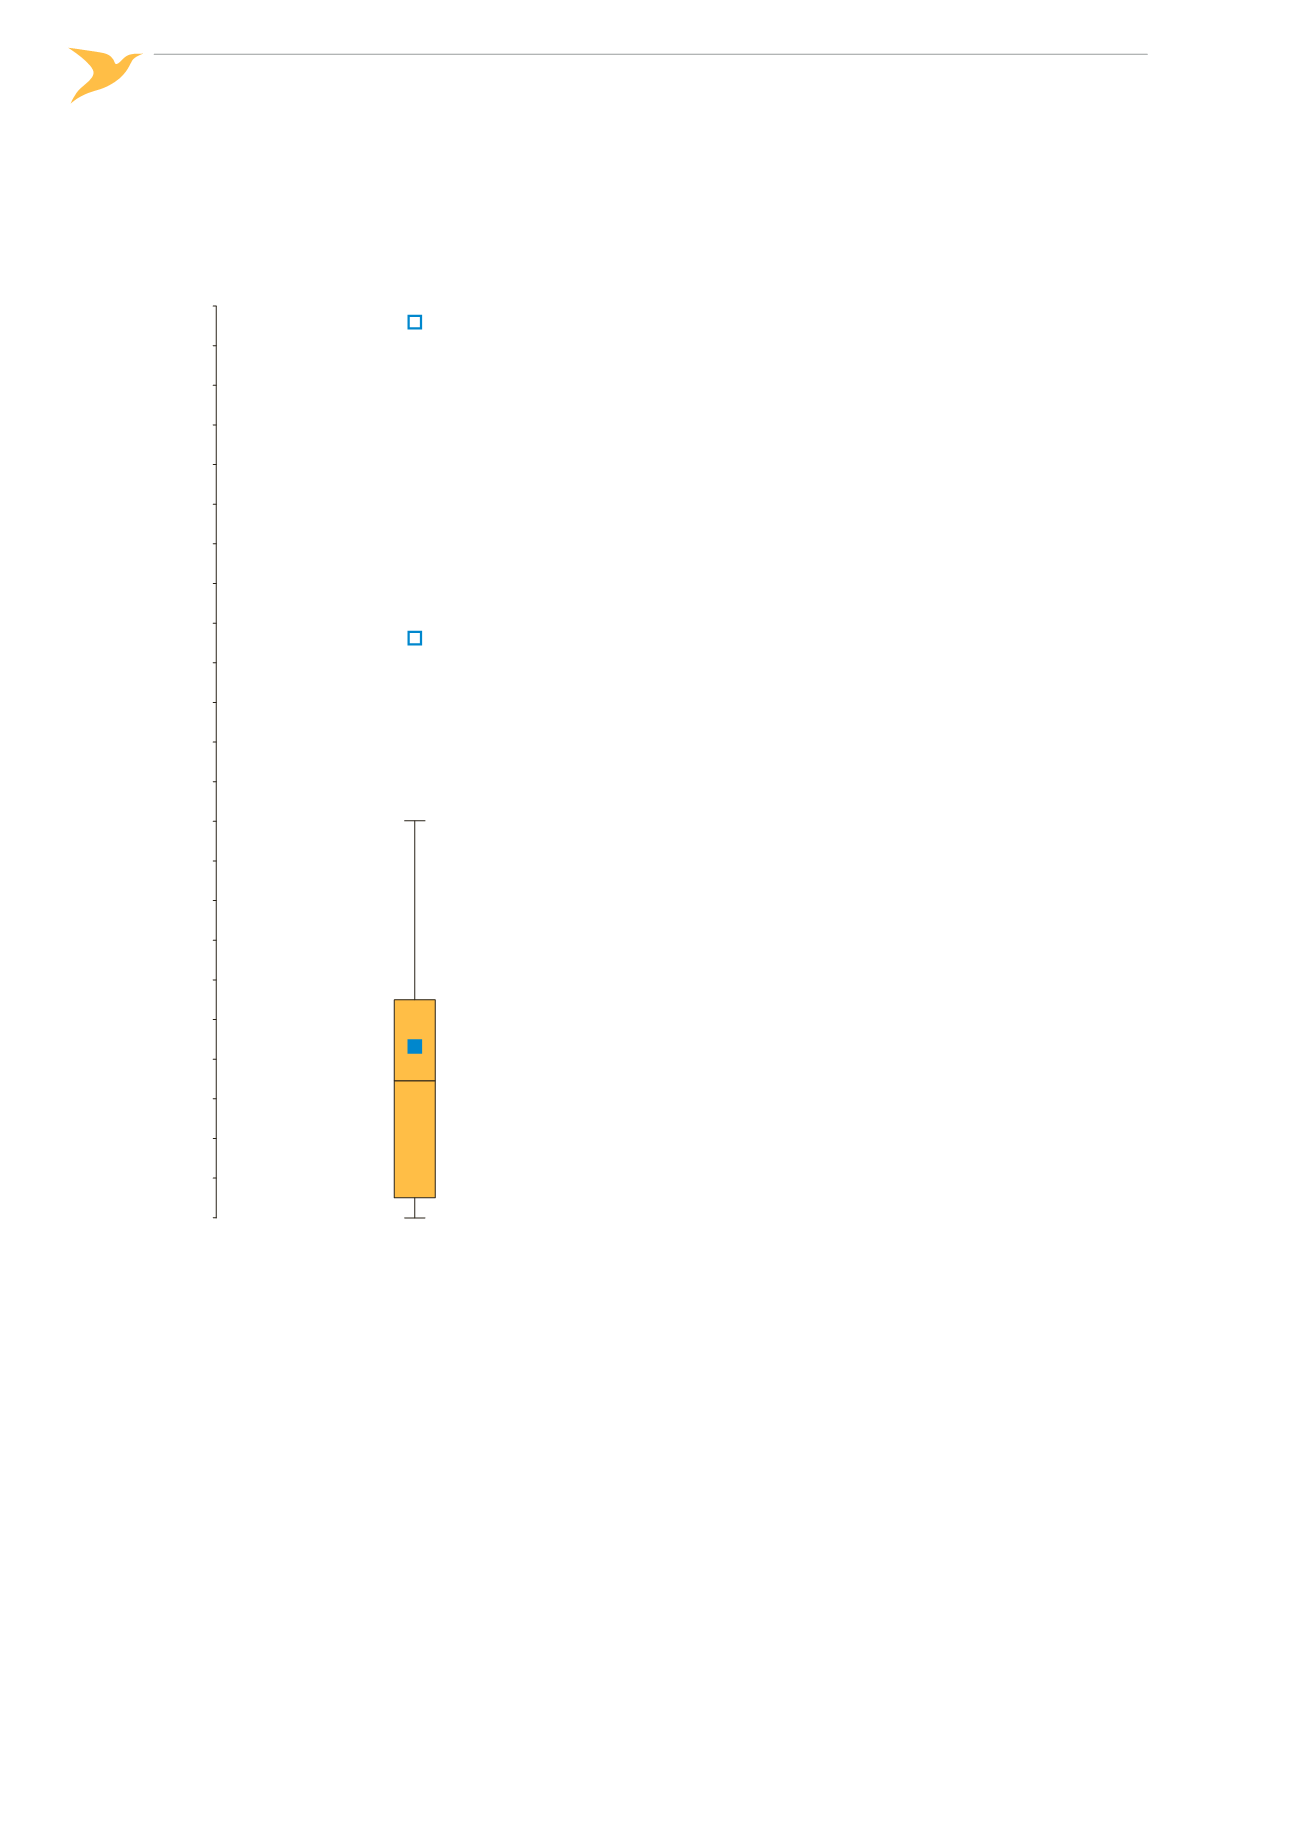
Figure 5:
Summary of the 32 EASA MS accident rates per 10,000 movements
0
0.01
0.02
0.03
0.04
0.05
0.06
0.07
0.08
0.09
0.10
0.11
0.12
0.13
0.14
0.15
0.16
0.17
0.18
0.19
0.20
0.21
0.22
0.23
< – Maximum, Outlier = 0.228
< – Outlier
< – Largest rate that is not an outlier
< – Upper Quartile = 0.055
< – Median = 0.035
< – Lower Quartile = 0.005
< – Minimum = 0.000
< – Average = 0.043
The main statistics and key points from the graph are:
§
§
The
average
(sometimes called the mean) accident rate is a measure of central tendency. This was
calculated by totalling the 32 accident rates and dividing by 32. The average was calculated as 0.043 ac‑
cidents per 10,000 movements and is represented in Figure 5 by a solid black dot in the centre of the
upper yellow box.
§
§
The
median
is another measure of central tendency. It is the mid‑point in the data where the accident
rates have been arranged in order from smallest to largest; effectively the middle point of the data. In
Figure 2, it is shown as a black line that splits the yellow box into two parts. The median accident rate
was 0.035 accidents per 10,000 movements, which is very close to the average accident rate.
§
§
The
minimum
is the lowest value in the dataset and was 0.00 accidents per 10,000 movements. This
means some States regulate AOC holders who did not have any accidents.