CS AWO.A.ALS.106 Performance demonstration
ED Decision 2022/007/R
(a) The automatic landing system, under the conditions for which its use is to be approved, shall be demonstrated to achieve the performance accuracy and the limits in point (c) below and taking into account at least the following variables:
(1) configurations of the aeroplane (e.g. flap settings);
(2) centre of gravity;
(3) landing weight;
(4) conditions of wind, turbulence and wind shear (see AMC AWO.A.ALS.106, paragraph 3);
(5) xLS characteristics (see AMC AWO.A.ALS.106, paragraph 4); and
(6) system tolerances.
If limitations are necessary in respect of any of these variables, then these shall be established.
(b) The accuracy limits of point (c) below shall be demonstrated by a combination of:
(1) an analysis (e.g. by simulation) considering reasonable combinations of variables listed in point (a) and in AMC AWO.A.ALS.106); and
(2) validation of any simulation/analysis by flight test demonstrations (using either statistical or deterministic methods).
(c) It shall be shown that the touchdown performance will be such that exceedance of any of the limits prescribed in this provision will be improbable (see AMC AWO.A.ALS.106, paragraph 1.4 for acceptable values for the actual probability level) when the variables follow their expected distribution and also when one of the variables is at its most critical value while the others vary in their expected manner:
(1) longitudinal touchdown earlier than a point on the runway 60 m (200 ft) from the threshold;
(2) longitudinal touchdown beyond the end of the touchdown zone (TDZ) lighting, 823 m (2 700 ft) from the threshold;
(3) lateral touchdown with the outboard landing gear greater than 21 m (70 ft) from runway centre line. This value assumes a 45-m (150-ft) runway. It may be appropriately changed if:
(i) operation is limited in the AFM to wider runways, or to runways with load-bearing shoulders; or
(ii) operation to narrower runways is requested and permitted;
(4) structural limit load; and
(5) bank angle resulting in hazard to the aeroplane.
[Issue: CS-AWO/2]
AMC AWO.A.ALS.106 Performance demonstration
ED Decision 2022/007/R
1 General
1.1 The analysis referred to in CS AWO.A.ALS.106(b)(1) should:
a. establish compliance with the performance limits specified in CS AWO.A.ALS.106(c);
Note: When systems employing automatic control of ground roll are provided, additional analysis may be required.
b. determine any limitations on the use of the system for compliance with the performance limits of CS AWO.A.ALS.106(c) (see CS AWO.A.ALS.114); and
c. provide, if appropriate, information necessary for the calculation of the required landing distance (see CS AWO.A.ALS.109).
1.2 Account should be taken of the variation of wind speed, turbulence, xLS beam characteristics, system performance variation and flight crew procedures. System performance variations due to equipment tolerances (e.g. datum shifts and gain changes) should be investigated taking into account setting up procedures and monitoring practices. Acceptable models of wind, turbulence and wind shear are given in paragraph 3. xLS signal-in-space characteristics are given in paragraph 4.
1.3 In accordance with CS AWO.A.ALS.107, the effects of aerodrome conditions (e.g. elevation, ambient temperature, touchdown zone slope and ground profile under the approach path) are to be investigated and, if necessary, appropriate limitations derived for inclusion in the AFM. For the purposes of this assessment, the touchdown zone slope is considered to be the slope of the runway between threshold up to 900 m from the runway threshold. Guidance is given in paragraph 5.
1.4 Acceptable values for the probabilities of exceedance of the limits of CS AWO.A.ALS.106(c) are as follows (these values may be varied where the characteristics of a particular aeroplane justify such variation):
|
|
Average |
Limit |
|
|
a. Longitudinal touchdown earlier than a point on the runway 60 m (200 ft) from the threshold. |
10-6 |
10-5 |
|
|
b. |
(i). Longitudinal touchdown beyond the end of the touchdown zone (TDZ) lighting, 823 m (2700 ft) from the threshold. |
10-6 |
Not applicable |
|
|
(ii). Longitudinal touchdown beyond the end of the touchdown zone (TDZ) lighting, 914 m (3000 ft) from the threshold. |
Not applicable |
10-5 |
|
c. Lateral touchdown with the outboard landing gear greater than 21 m (70 ft) from the runway centre line, assuming a 45 m (150 ft) runway. |
10-6 |
10-5 |
|
|
d. Structural limit load (see paragraph 1.4.1). |
10-6 |
10-5 |
|
|
e. Bank angle such that the wing tip, engine nacelle or propeller touch the ground before the wheels. |
10-7 |
10-6 |
|
Note 1: The ‘Average’ column is the acceptable probability of exceedance where all the variables vary according to their probability distributions. The ‘Limit’ column is the acceptable probability of exceedance if one variable is held at its most adverse value, while the other variables vary according to their probability distributions. In the case where a wind variable is held at its most adverse value, the acceptable probability of exceedance should be taken as the average column factored by the cumulative probability of reported wind as defined in Figure 15 of Appendix 1 to the AMC to Subpart A ‘MODELS’.
Note 2: For HUDLSs, an alternative means of compliance for CS AWO.A.ALS.106(c) may be used. One acceptable means of compliance is given in paragraph 1.4.2 of this AMC.
1.4.1 An acceptable means of establishing that the structural limit load is not exceeded is to show separately and independently that:
a. the sink rate at touchdown does not exceed the limit rate of descent used for certification under CS-25 Subpart C, or 10 ft per second, whichever is the greater; and
b. the lateral side load does not exceed the limit value determined for the lateral drift landing condition defined in CS 25.479(d)(2).
1.4.2 For HUDLSs, where the total wind strength has been shown to be the most critical parameter affecting performance, an alternative means of compliance for CS AWO.A.ALS.106(c) may be used.
An acceptable method, based on the demonstration of 80 approaches performed in a simulator at limiting wind conditions using a representative wind model, covering 8 cardinal points, has been shown to provide adequate demonstration of system robustness, provided that the resulting go-around rate does not exceed 20 %.
1.5 Acceptance limits for automatic speed holding are ±9.3 km/h (±5 kt) (two standard deviations) of programmed airspeed (disregarding rapid airspeed fluctuations associated with turbulence) under all intended flight conditions.
2 Flight demonstrations
2.1 A programme of landings should be completed sufficient to demonstrate the validity of the simulation and support the conclusions of the analysis.
Note: Typically, programmes of 100 landings have been used.
Data taken during demonstration flight tests should be used to validate the simulation(s). The objective of a flight test programme should be to demonstrate performance of the system to 100 % of the steady state wind limit values that are used in the simulation statistical performance analysis.
Nevertheless, if during the flight test campaign it is not possible to flight-test 100 % of the steady state wind limit, the applicant may request acceptance that the simulation be validated, if at least four landings are accomplished during flight test at no less than 80 % of the intended limit steady state wind value (i.e. mean wind), and if it has been shown that the landing system is sufficiently robust near the desired AFM wind limits for which application is made.
The robustness of autoland will be assessed as sufficient if:
— the analysis of the automatic landing system behaviour encountered during flight tests for the four landings selected by the applicant shows satisfactory margins in authority and performance;
— the analysis of the matching between flight test and simulation for the four landings selected by the applicant shows satisfactory correlation; if the four landings flight-tested show satisfactory margins and performance, the matching requested may be limited to a subset of the four landings selected;
— aircraft loading conditions flown during the four landings (weight and centre of gravity (CG)) are sufficiently close to the sizing conditions that would have an influence on wind demonstration limits (sizing conditions in terms of unfavourable combination of weight and CG as defined in the certification flight test programme); and
— the analysis of the automatic landing system behaviour during simulation with the steady state wind limit value (i.e. mean wind), at the wind limit requested, shows remaining margins for performance.
The steady state wind limit value can be determined by one of the following:
a. mean wind value + half gust, as reported by air traffic control (ATC); or
b. mean wind recorded by the flight test instrumentation, i.e. average of the wind recorded for 20 seconds around the touchdown point and recomputed at 33 ft, with the following additional considerations:
• additional credit can be taken for the maximum average wind demonstrated during the flight test if the gust encountered during flight test shows a higher intensity than the one tested during simulation (meaning the wind increase to the average wind is higher during flight test compared to the simulation);
• in this case, to give a revised maximum average wind demonstrated during flight test, the mean wind recorded by the flight test instrumentation may be increased by the difference between flight‑tested and simulation-tested gust intensity;
c. the calculated mean wind plus the maximum gust recorded by flight test instrumentation throughout the landing.
The maximum gust may be calculated using a 3-second moving average filter in the instantaneous calculated wind from a height of 50 ft to the termination of the test event or an airspeed such that all data necessary for the computation is available and of sufficient accuracy. The measured wind should be corrected from the height of the measurement device to a height of 33 ft.
2.2 Individual landings should be carried out to demonstrate that errors, which can reasonably be expected to occur, are not hazardous; for example:
— landing with approach speed 9.3 km/h (5 kt) below the specified speed, and
— landing with approach speed 18.5 km/h (10 kt) above the specified speed.
3 Wind Model for Approach Simulation
In carrying out the analysis described in paragraph 1, one of the wind, turbulence and wind shear models contained in Appendix 1 to the AMC to Subpart A may be used.
4 Models of xLS signals-in-space for use in approach simulations
4.1 Automatic landing system evaluation, including computer analysis of system performance, should be based on the use of xLS ground facilities, which meet the performance characteristics, listed herein.
4.2 Analysis of results of in-flight demonstrations may include subtraction of measured signal-in-space signal errors, and treatment of the contribution of the signal-in-space error on a probability basis. (See CS AWO.A.ALS.106(b)(2).)
4.3. In carrying out any analysis, the models contained in Appendix 1 to the AMC to Subpart A should be utilised.
5 Aerodrome conditions
5.1 Elevation and temperature
The effects of aerodrome elevation and ambient temperature should be examined where operation is envisaged at aerodromes above 750 m (2 500 ft) or in temperatures greater than International Standard Atmosphere (ISA)+ 15°C.
5.1.1 High-altitude landing system demonstration using simulation
5.1.1.1 The following describes an acceptable means to demonstrate performance of landing systems at high altitude with a combination of flight test results and validated simulation. The aerodrome elevation at which satisfactory performance of the landing system has been demonstrated by this method may then be documented in the AFM. The flight test demonstration is considered as the primary source of data, which can then be supplemented with data from a validated simulation.
5.1.1.2 The minimum required altitude or elevation for the flight test which is used to demonstrate a desired AFM elevation value, by this method, is shown in Figure 2 and the accompanying table below. For example, the applicant may document an AFM elevation value of 8 000 ft, by a successful flight demonstration at 8 000 ft, or by a flight demonstration at a minimum elevation of 5 000 ft with a simulation to the desired 8 000 ft.
Note: The lines in Figure 2 converge at 11 000 ft, indicating that credit for simulation is not available at 11 000 ft or above.
The atmospheric temperature and pressure during the flight test, for either method, should not be more favourable than the ISA conditions, to ensure that the density altitude is not lower than the aerodrome elevation. When the density altitude value of the flight test is lower than the aerodrome elevation, then the density altitude value should be used as the effective flight-test-demonstrated elevation which will decrease the maximum AFM elevation value.
5.1.1.3 Establishing a baseline of landing system performance, for the purposes of subsequently using simulation to obtain a high-altitude approval, will require a sufficient programme of landings at the flight-test-demonstrated elevation shown in Figure 2, to demonstrate the validity of the simulation and to support the conclusions of the analysis.
Note: Typically, programmes of 10–15 landings should be used.
An alternative method for simulation validation may be used if found acceptable by EASA.
5.1.1.4 A simulation may then be conducted with cases at the selected AFM elevation value with the range of atmospheric conditions listed below. A sensitivity analysis should be conducted to ensure that performance is not unsafe near any limits. Unless otherwise found acceptable by EASA, simulation cases should typically include the following:
a. temperatures ranging from ISA value to ISA +40°C;
b. barometric pressure ranging from ISA value for that elevation to ISA –50 hPa; and
c. mean wind variations, including:
— headwinds to at least 25 kt;
— crosswinds to at least 15 kt; and
— tailwinds to at least 10 kt.
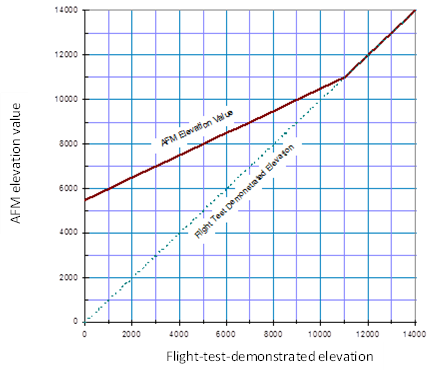
Figure 2: AFM elevation value from flight test and validated simulation
|
AFM elevation value from flight test and validated simulation (feet above mean sea level (MSL)) |
Required elevation of flight test demonstration (feet above mean sea level (MSL)) |
|
5 500 |
0 |
|
6 000 |
1 000 |
|
6 500 |
2 000 |
|
7 000 |
3 000 |
|
8 000 |
5 000 |
|
9 000 |
7 000 |
|
10 000 |
9 000 |
|
11 000 |
11 000 |
Table associated with Figure 2
5.1.2 High-altitude landing system demonstration using flight test only
For applicants that wish to demonstrate landing system performance at high‑elevation runways on the basis of flight tests only, i.e. without the use of simulation to extrapolate from the demonstrated elevation, a flight test programme should be presented to EASA for approval.
An acceptable programme should include approximately 10–15 approaches and landings, conducted with an instrumented aircraft, in conditions covering the range of operational weight, centre of gravity (CG), and aircraft configuration. One-engine-inoperative conditions should also be considered, if relevant. The recorded data should allow the assessment of touchdown performance (i.e. touchdown distance, lateral deviation and vertical speed).
5.2 Ground profile
5.2.1 Where use is made of height above ground indicators that depends on the ground profile (such as radio-altimeter signals)in the automatic landing system, any effects of the ground profile before the runway or along the runway on the performance of the system should be examined.
5.2.2 The family of profiles to be investigated should take due account of the way in which the system uses the height above ground indicator (such as radio-altimeter signals) at different heights on the approach. Terrain and runway up slopes, down slopes and other terrain irregularities should be investigated.
Note: Information on the characteristics of aerodromes is contained in ICAO Annex 14. The examination of a number of aerodromes used for automatic landing has shown that the following features may be encountered:
a. sloping runway – slopes of 0.8 %;
b. hilltop runway – 12·5 % slope up to a point 60 m prior to the threshold; or
c. sea-wall – 6 m (20 ft) step up to threshold elevation at a point 60 m prior to the threshold.
5.2.3 Performance demonstration on a particular runway
The acceptable average values for probabilities of exceedance limits of CS AWO.ALS.106 provided in paragraph 1.4 consider all possible runways where the aircraft can be operated. When considering a particular aerodrome some factors identified in paragraphs 1.2 and 1.4 are known (e.g. altitude, runway length, specific ILS characteristics, touchdown zone and pre-runway threshold longitudinal profile, etc.). In order to assess adequate performance on a particular runway, limit risks can be used as success criteria, having all other parameters varying within their approved limits unless specific restrictions apply to this runway.
6 Fog model
For simulator testing associated with the certification of HUDLSs, the applicant may propose a fog model. The proposed fog model will have to be acceptable to EASA.
[Issue: CS-AWO/2]
CS AWO.A.ALS.107 Aerodrome conditions
ED Decision 2022/007/R
Expected aerodrome conditions (e.g. elevation, ambient temperature, touchdown zone slope and ground profile under the approach path) shall be considered and appropriate limitations entered in the AFM. (See AMC AWO.A.ALS.106, paragraph 5)
[Issue: CS-AWO/2]
CS AWO.A.ALS.108 Approach and automatic landing with an inoperative engine
ED Decision 2022/007/R
(See AMC AWO.A.ALS.108)
If approval is sought to include automatic landing where the approach is initiated, and the landing made, with an inoperative engine, the automatic landing system shall be shown to perform a safe landing and, where applicable, safe roll-out in this non-normal aircraft condition, taking account of the following:
(a) the critical engine inoperative, with the propeller, where applicable, feathered;
(b) all flap positions used for landing with an inoperative engine;
(c) loss of systems associated with the inoperative engine, e.g. electrical and hydraulic power;
(d) crosswinds in each direction not less than 18.5 km/h (10 kt); and
(e) weight and centre of gravity of the aircraft.
The go-around from any point on the approach to touchdown shall not require exceptional piloting skill, alertness or strength, and shall ensure that the aeroplane remains within the obstacle limitation surface for the limitation surface for the approach design criteria used.
[Issue: CS-AWO/2]
AMC AWO.A.ALS.108 Approach and automatic landing with an inoperative engine — Performance demonstration
ED Decision 2022/007/R
1 The identification of a critical engine should consider the effects on performance, handling, loss of systems, and autoland status. More than one engine may be critical for different reasons.
2 If the aeroplane configuration and operation are the same as those used in the performance demonstration of CS AWO.A.ALS.106 for the all-engine operating case, compliance with CS AWO.A.ALS.108 may be demonstrated by, typically, 10 to 15 landings, or by statistical analysis supported by flight test if the aeroplane configuration or operation is changed significantly from the all-engine operating case.
3 If the aeroplane configuration and operation are not the same as for the all-engine operating case, the effect on landing distance will need to be considered.
4 To aid planning for automatic landing with an inoperative engine, appropriate procedures, performance, and obstacle clearance information will need to be established enabling a safe go-around at any point in the approach.
5 For the purposes of this requirement, demonstration of automatic landing and go-around performance in the event of a second engine failure need not be considered.
[Issue: CS-AWO/2]
CS AWO.A.ALS.109 Automatic landing distance
ED Decision 2022/007/R
The landing distance required shall be established and scheduled in the AFM if it exceeds the distance scheduled for manual landing for the same conditions (see AMC AWO.A.ALS.109).
[Issue: CS-AWO/2]
AMC AWO.A.ALS.109 Automatic landing distance
ED Decision 2022/007/R
The landing distance referred to in CS AWO.A.ALS.109 may be derived as follows:
(a) The configuration procedure and speed should be those recommended for an automatic landing.
(b) The distance from the runway threshold to the touchdown point should be the distance from the runway threshold to the glideslope origin (SO) plus the mean distance from the glideslope origin to touchdown (STD) plus three times the standard deviation of the distance from the glideslope origin to touchdown σ (STD).
(c) The gross distance from touchdown to a complete stop should be determined in accordance with CS 25.125, assuming a touchdown speed equal to the main touchdown speed plus three standard deviations of the touchdown speed.
Note: The main values and standard deviations considered in points (b) and (c) should be based on random variations. Systematic variation of parameters should cover the normal range of flight manual conditions.
The landing distance required should be taken as the distance from the runway threshold to the touchdown point, as defined in (b), factored by 1.15 (i.e. 1.15 (SO + STD + 3 σ (STD)), plus the ground-roll distance defined in (c), multiplied by a factor of 1.15.
(d) The landing distance required should include corrections for variations in the glideslope angle and variations in the glideslope height at the threshold. Alternatively, these effects may be included by use of conservative assumptions in the basic presentation of data, with the applicable ranges stated in the AFM.
Note: The landing distance as derived in (a) to (d) should be compared with the normal landing distance according to CS 25.125.
[Issue: CS-AWO/2]