


 99 / 168

PAGE
97
´
´
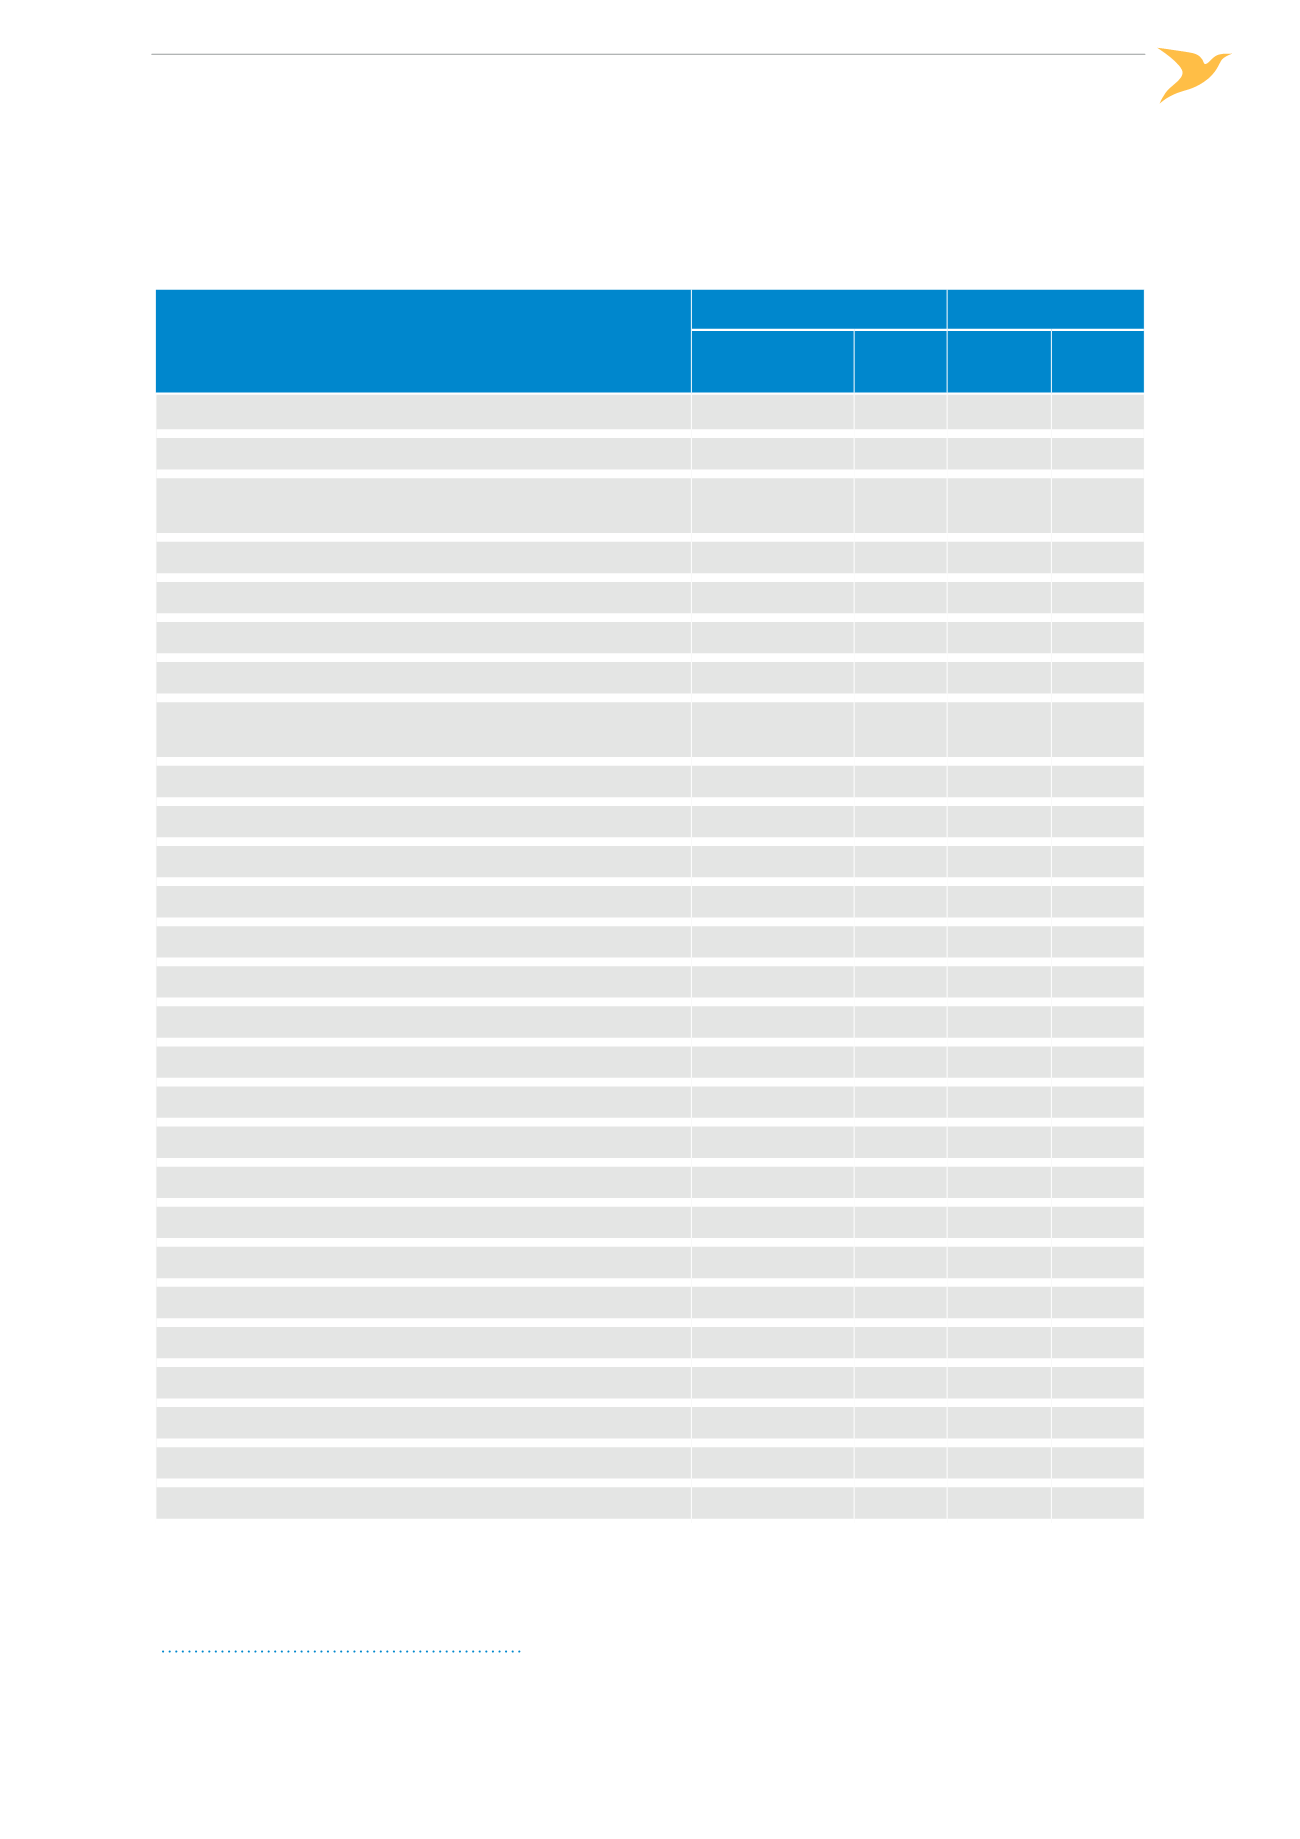
Table 28:
Glider accidents per occurrence category - 5 year average vs 2014
13
Occurrence Category
Non‑Fatal Accidents
Fatal Accidents
2009-2013
average
2014
2009-2013
average 2014
LOC‑I: Loss of control - inflight
24.2
22
17
11
GTOW: Glider towing related events
19
12
2
3
SCF‑NP: System/component failure or malfunction
[non‑powerplant]
13.6
9
1.6
3
AMAN: Abrupt maneuvre
1.4
3
0.2
1
ARC: Abnormal runway contact
56.2
48
0.2
1
CFIT: Controlled flight into or toward terrain
3.4
5
2
1
LALT: Low altitude operations
4.6
5
2.2
1
MAC: Airprox/ACAS alert/loss of separation/(near) midair
collisions
4.8
7
2
1
UNK: Unknown or undetermined
2.8
8
2.6
1
LOLI: Loss of lifting conditions en‑route
43
34
1.8
0
CTOL: Collision with obstacle(s) during take‑off and landing
19
17
0.8
0
TURB: Turbulence encounter
3
3
0.6
0
BIRD: Birdstrike
0.6
0
0.4
0
F‑POST: Fire/smoke (post‑impact)
0
1
0.4
0
GCOL: Ground Collision
7.8
9
0.2
0
RE: Runway excursion
11.8
8
0.2
0
USOS: Undershoot/overshoot
12.6
9
0.2
0
WSTRW: Windshear or thunderstorm.
2.6
4
0.2
0
ADRM: Aerodrome
1.6
2
0.2
0
LOC‑G: Loss of control - ground
13.6
12
0
0
OTHR: Other
8.4
6
0
0
SCF‑PP: powerplant failure or malfunction
5.8
4
0
0
FUEL: Fuel related
0.4
1
0
0
RI‑VAP: Runway incursion - vehicle, aircraft or person
0.8
0
0
0
RAMP: Ground Handling
0.4
0
0
0
EVAC: Evacuation
0.2
0
0
0
RI‑A: Runway incursion - animal
0.2
0
0
0
13 Occurrence categories missing from the table were deliberately deleted as they showed no data.