


 30 / 168

Annual Safety Review 2014
Worldwide Safety
PAGE
28
EASA Member States Comparison with the Rest of the World
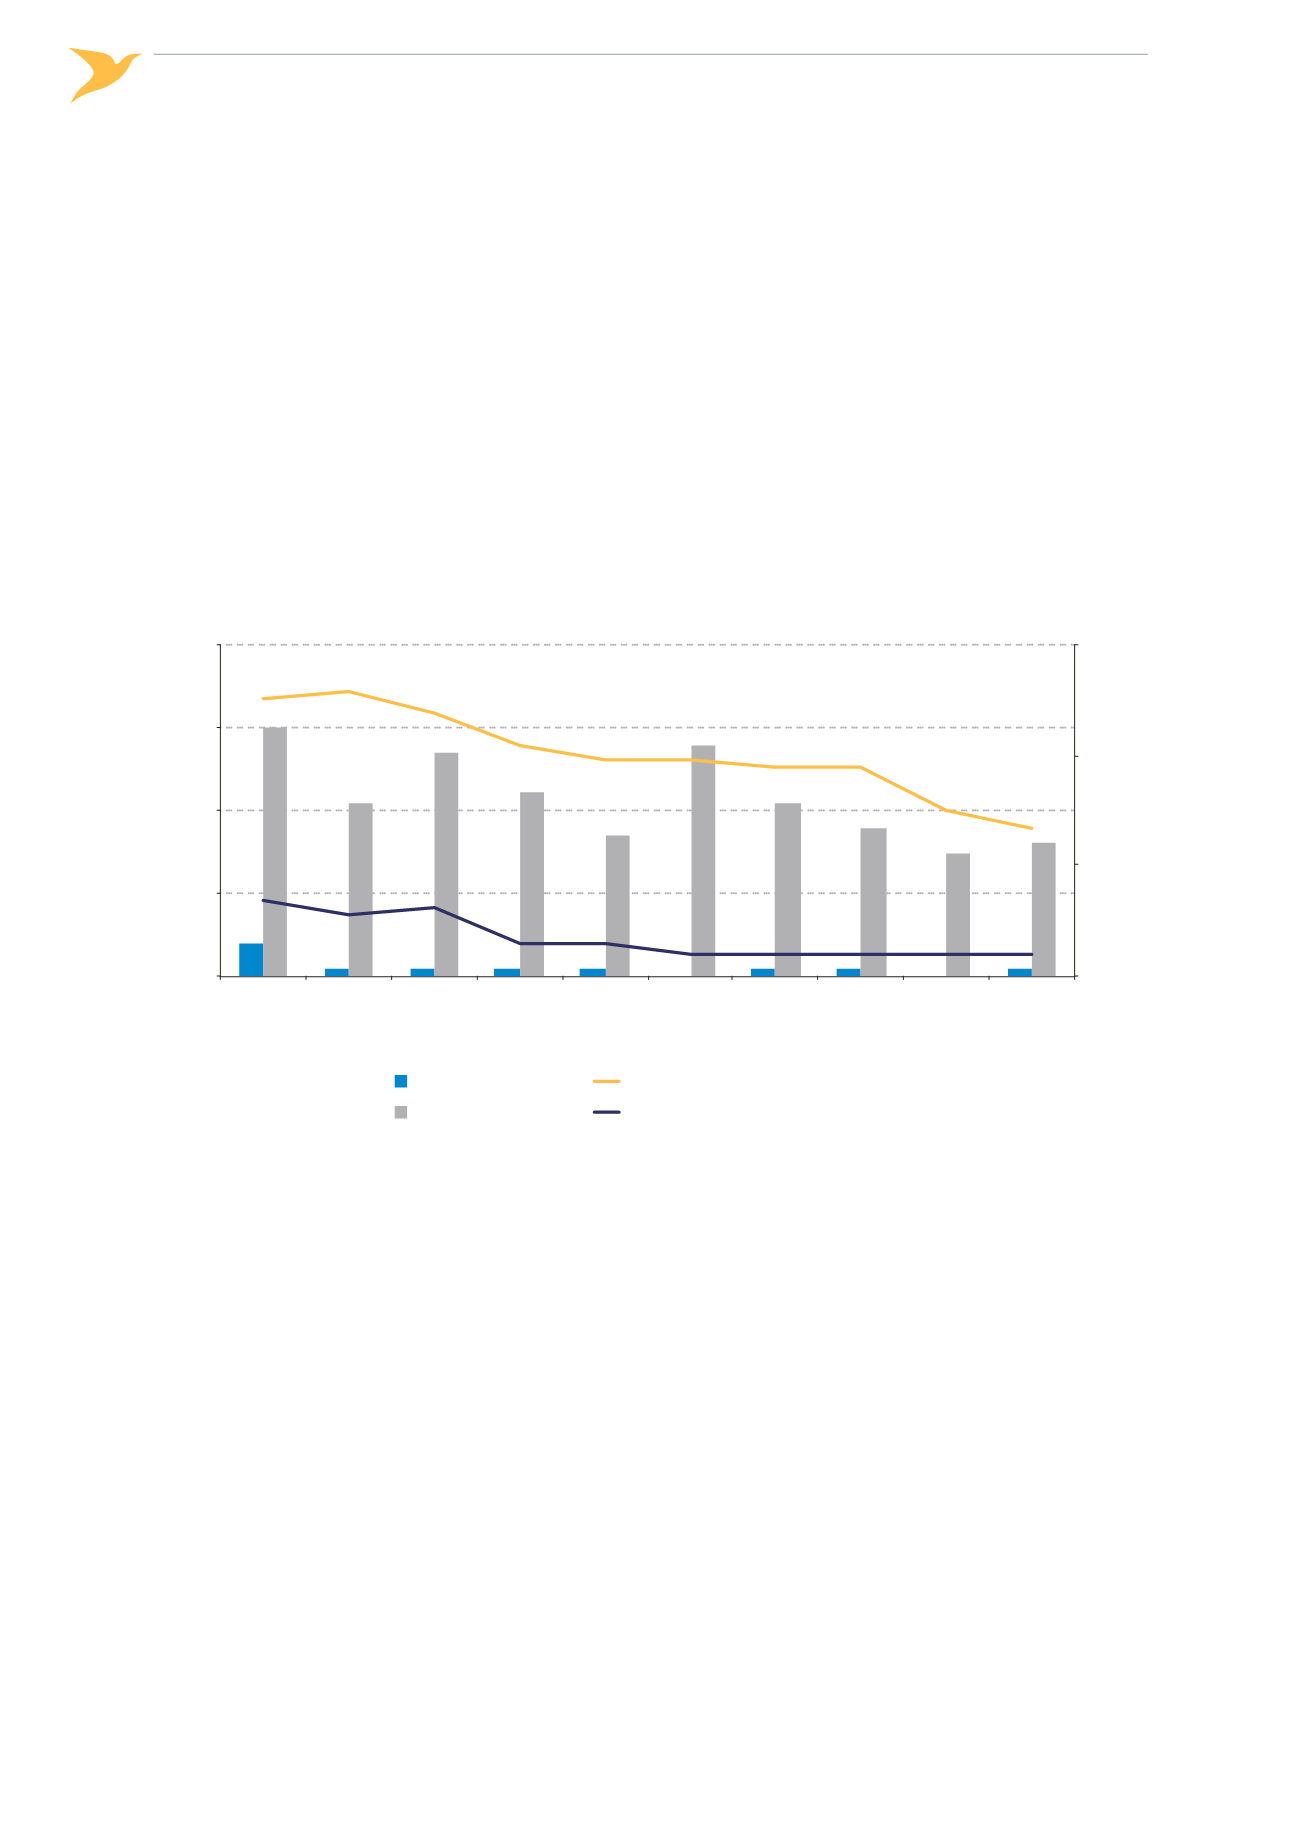
The fatal accident rate of EASA Member States compared to that of the rest of the world is shown in Figure 2. The
fatal accident rate for EASA Member States (Lower Line) compares favourably with that for the rest of the world
(Upper Line), highlighting the continued high level of safety in European aviation. In the EASA Member States,
not more than one fatal accident per year in Commercial Air Transport has occurred since 2005 and no fatal ac‑
cidents occurred in 2010 and 2013.
´
´
Figure 2:
Number and rate of fatal accidents worldwide, involving passenger and cargo
operations, maximum take‑off mass above 5,700 kg, comparing EASA MS with the rest
of the world, 2005-2014
0
5
10
15
0
10
20
30
40
2005
2006
2007
2008
2009
2010
2011
2012
2013
2014
Fatal Accidents per 10 Million Flights
Fatal Accidents
Year
EASA MS
Rest of World
Rest of the World Fatal Accident Rate
EASA MS Fatal Accident Rate